Fig. A.2.
Download original image
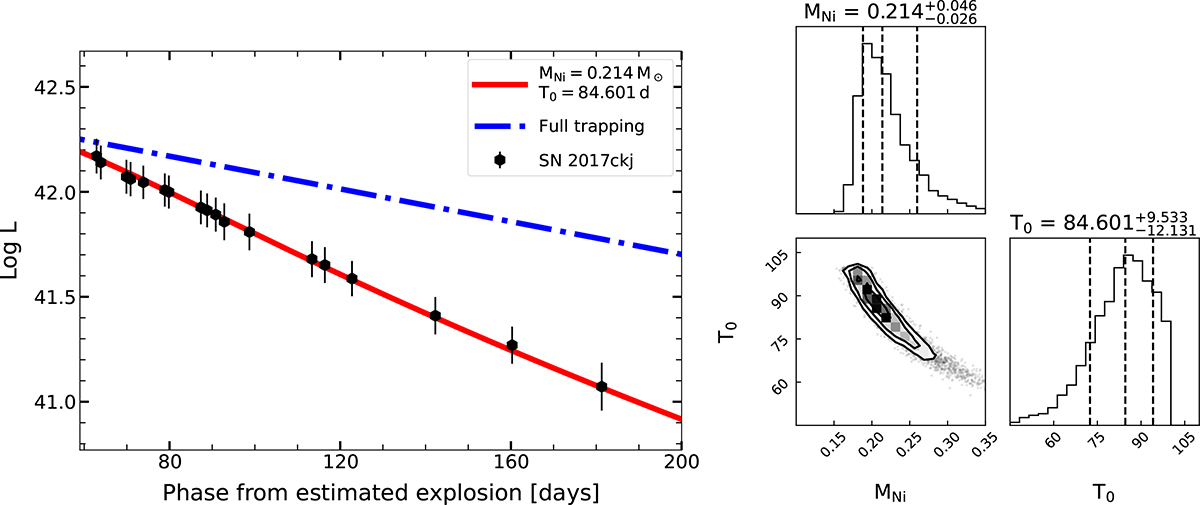
Fit of the modified radioactive decay model to the late-time full bolometric light curve of SN 2017ckj. In the left panel, the bolometric light curve fitting is shown by the red solid line, while the full γ-ray trapping model is presented in blue dashed-dotted line for comparison. The right panel presents the posterior distribution from MCMC sampling. The mean of the posterior distribution and 1σ uncertainties are marked.
Current usage metrics show cumulative count of Article Views (full-text article views including HTML views, PDF and ePub downloads, according to the available data) and Abstracts Views on Vision4Press platform.
Data correspond to usage on the plateform after 2015. The current usage metrics is available 48-96 hours after online publication and is updated daily on week days.
Initial download of the metrics may take a while.