Fig. 3.
Download original image
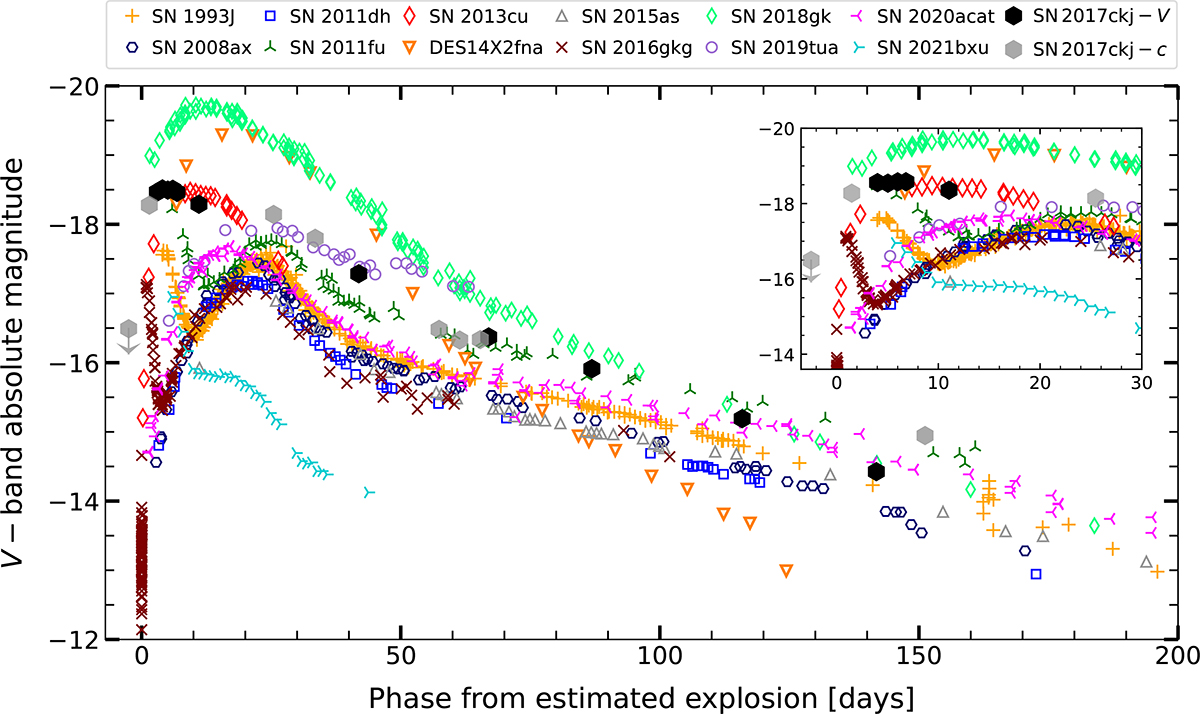
Absolute V-band light curve of SN 2017ckj compared to other SNe IIb. The ATLAS absolute c-band data of SN 2017ckj are also plotted with grey prismatic dots, as the V-band data is missing from 15 to 40 days. The subplot (upper right) displays the initial 30 days of absolute light curves. Note that DES14X2fna and SN 2013cu lack the V-band observations, therefore, we substitute with r-band data.
Current usage metrics show cumulative count of Article Views (full-text article views including HTML views, PDF and ePub downloads, according to the available data) and Abstracts Views on Vision4Press platform.
Data correspond to usage on the plateform after 2015. The current usage metrics is available 48-96 hours after online publication and is updated daily on week days.
Initial download of the metrics may take a while.