Open Access
Fig. 6.
Download original image
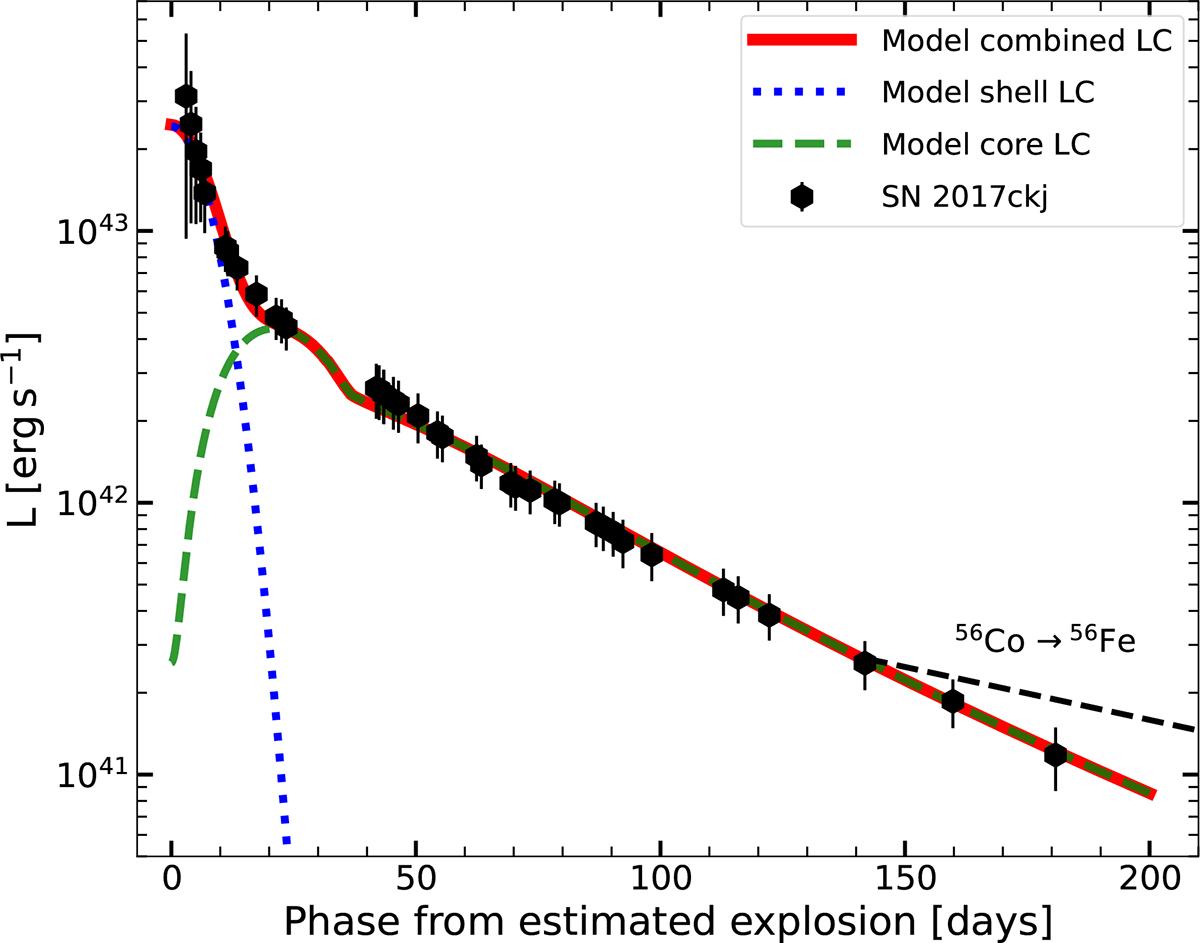
Full bolometric light curve of SN 2017ckj (black dots) fitted with the two-component model of Nagy & Vinkó (2016), including γ-ray leakage. The green and blue curves represent the contribution from the He-rich core and the extended H-envelope, respectively, while the red line shows the combined light curve.
Current usage metrics show cumulative count of Article Views (full-text article views including HTML views, PDF and ePub downloads, according to the available data) and Abstracts Views on Vision4Press platform.
Data correspond to usage on the plateform after 2015. The current usage metrics is available 48-96 hours after online publication and is updated daily on week days.
Initial download of the metrics may take a while.