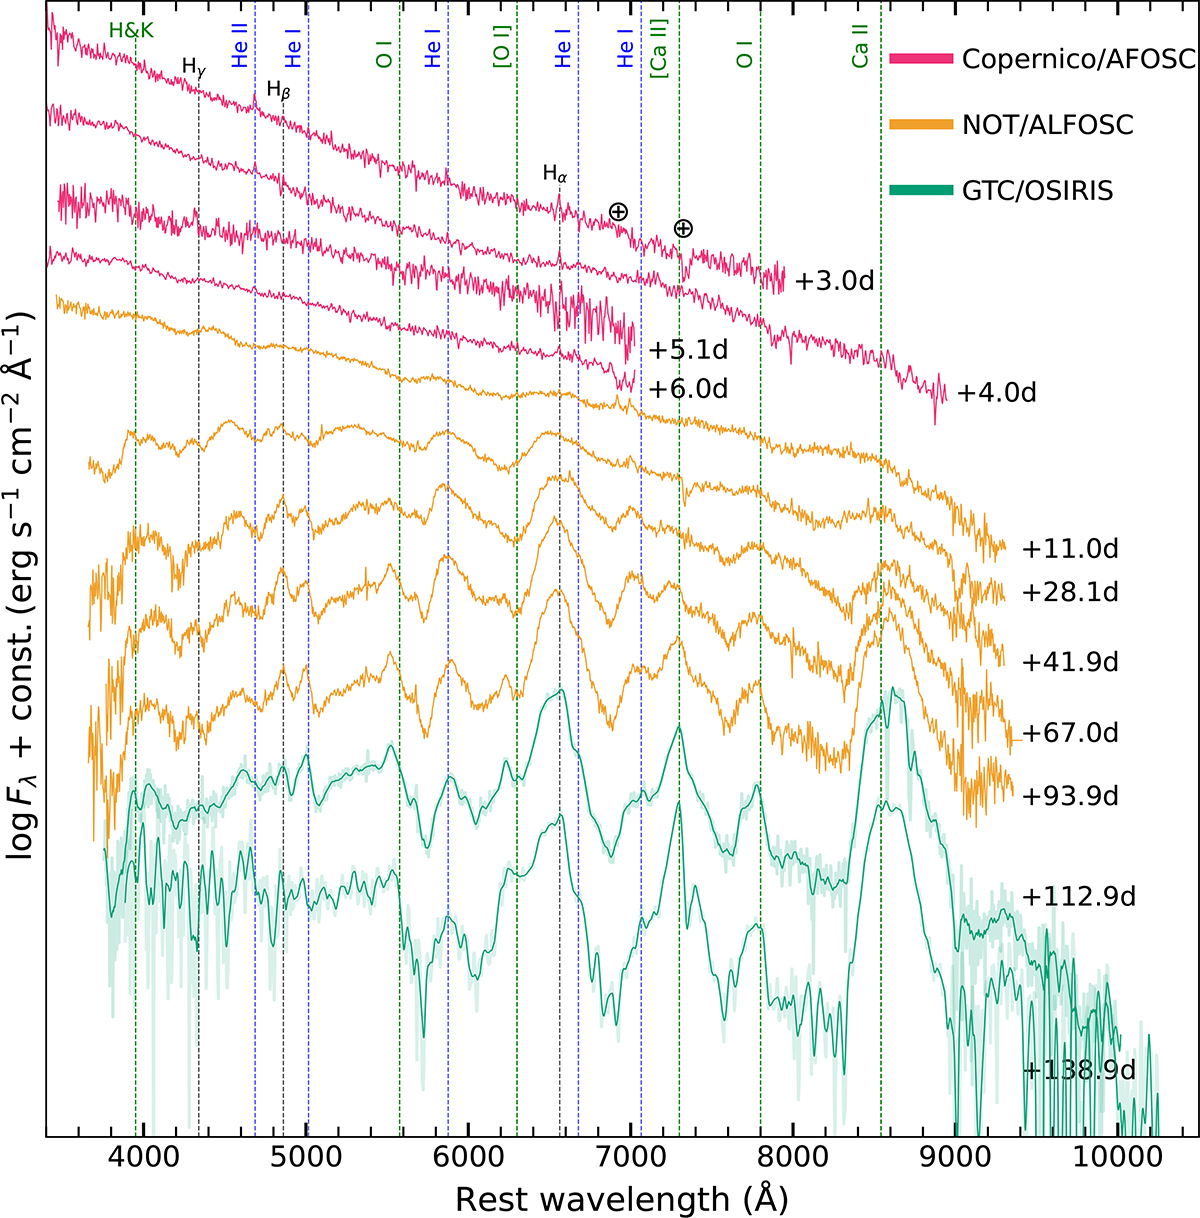
Fig. 7.
Download original image
Spectral sequences of SN 2017ckj. The positions of the principal transitions from H, He and other spectral elements are highlighted by the dashed vertical lines. The ⊕ symbols mark the position of the strongest telluric absorption bands. The phase of spectra based on the estimated explosion epoch (MJD = 57837.1 ± 0.1) is given on the right-hand side. All spectra have been corrected for redshift and extinction. The last two spectra, with lower signal-to-noise ratio (S/N), have been smoothed using a Savitzky-Golay filter.
Current usage metrics show cumulative count of Article Views (full-text article views including HTML views, PDF and ePub downloads, according to the available data) and Abstracts Views on Vision4Press platform.
Data correspond to usage on the plateform after 2015. The current usage metrics is available 48-96 hours after online publication and is updated daily on week days.
Initial download of the metrics may take a while.