Fig. 1.
Download original image
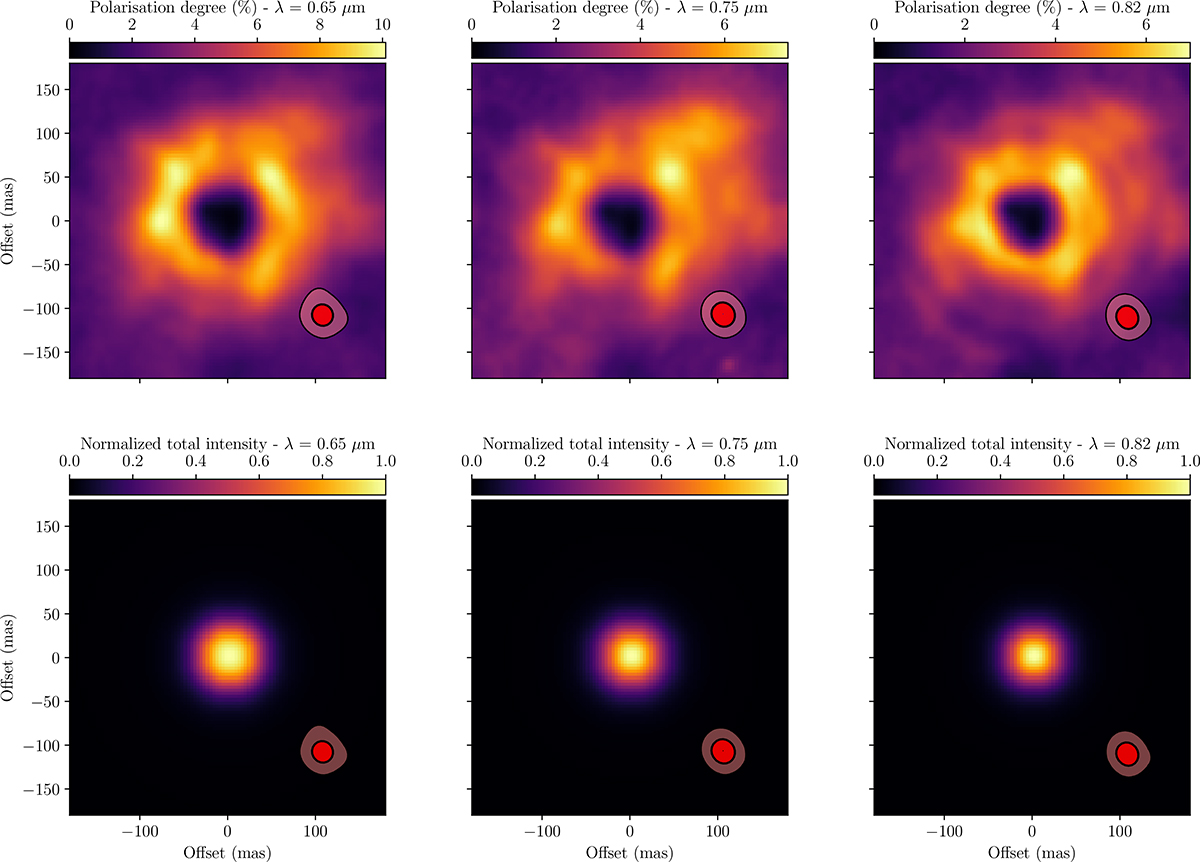
Polarisation degree maps (top row) and normalised total intensity maps (bottom row) of R Dor observed with VLT/SPHERE-ZIMPOL at three wavelengths: 0.65 μm (left), 0.75 μm (middle), and 0.82 μm (right). The red contours in the bottom right of each panel show the instrument PSF at the 10% and 50% intensity levels (see Appendix A for the complete PSF maps).
Current usage metrics show cumulative count of Article Views (full-text article views including HTML views, PDF and ePub downloads, according to the available data) and Abstracts Views on Vision4Press platform.
Data correspond to usage on the plateform after 2015. The current usage metrics is available 48-96 hours after online publication and is updated daily on week days.
Initial download of the metrics may take a while.