Fig. 3.
Download original image
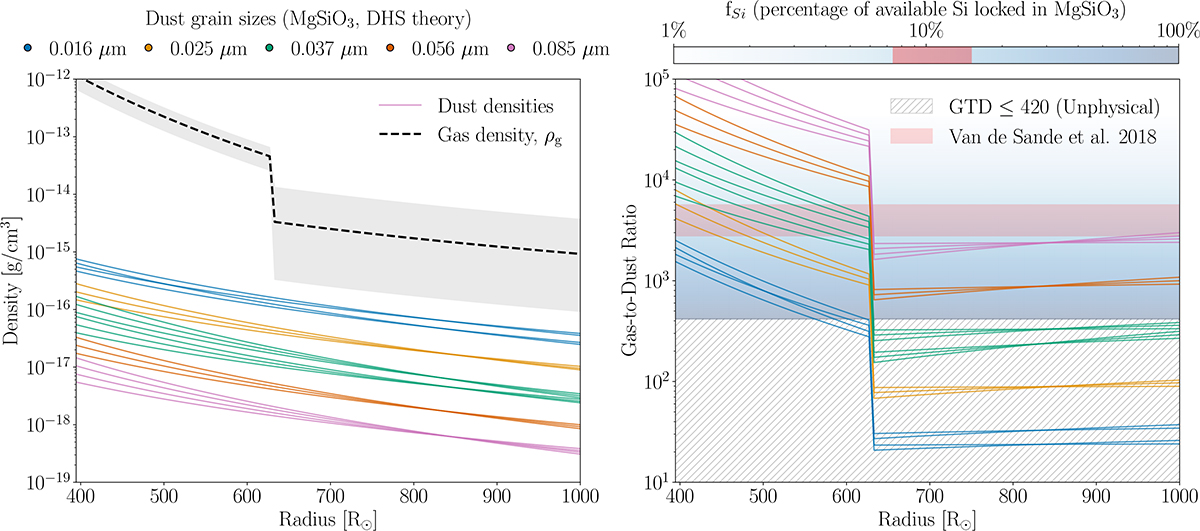
Dust and gas properties around R Dor considering MgSiO3 dust using DHS scattering theory. Left panel: Density profiles showing the gas density (dashed black line with grey uncertainty region) from Khouri et al. (2024) and dust densities for different grain sizes (coloured lines) corresponding to models that fit the observational constraints. The gas density exhibits a transition at 1.6 × R887 (Khouri et al. 2024). Right panel: Gas-to-dust (GTD) ratios derived from the density profiles. The hatched area (GTD ≤ 420) represents unrealistic values where more silicon would be locked in dust than expected in the stellar atmosphere. The red horizontal band shows constraints from SiO-depletion measurements (Van De Sande et al. 2018). The background colour gradient indicates the percentage of available silicon locked in dust grains, from 1% (light blue) to 100% (dark blue).
Current usage metrics show cumulative count of Article Views (full-text article views including HTML views, PDF and ePub downloads, according to the available data) and Abstracts Views on Vision4Press platform.
Data correspond to usage on the plateform after 2015. The current usage metrics is available 48-96 hours after online publication and is updated daily on week days.
Initial download of the metrics may take a while.