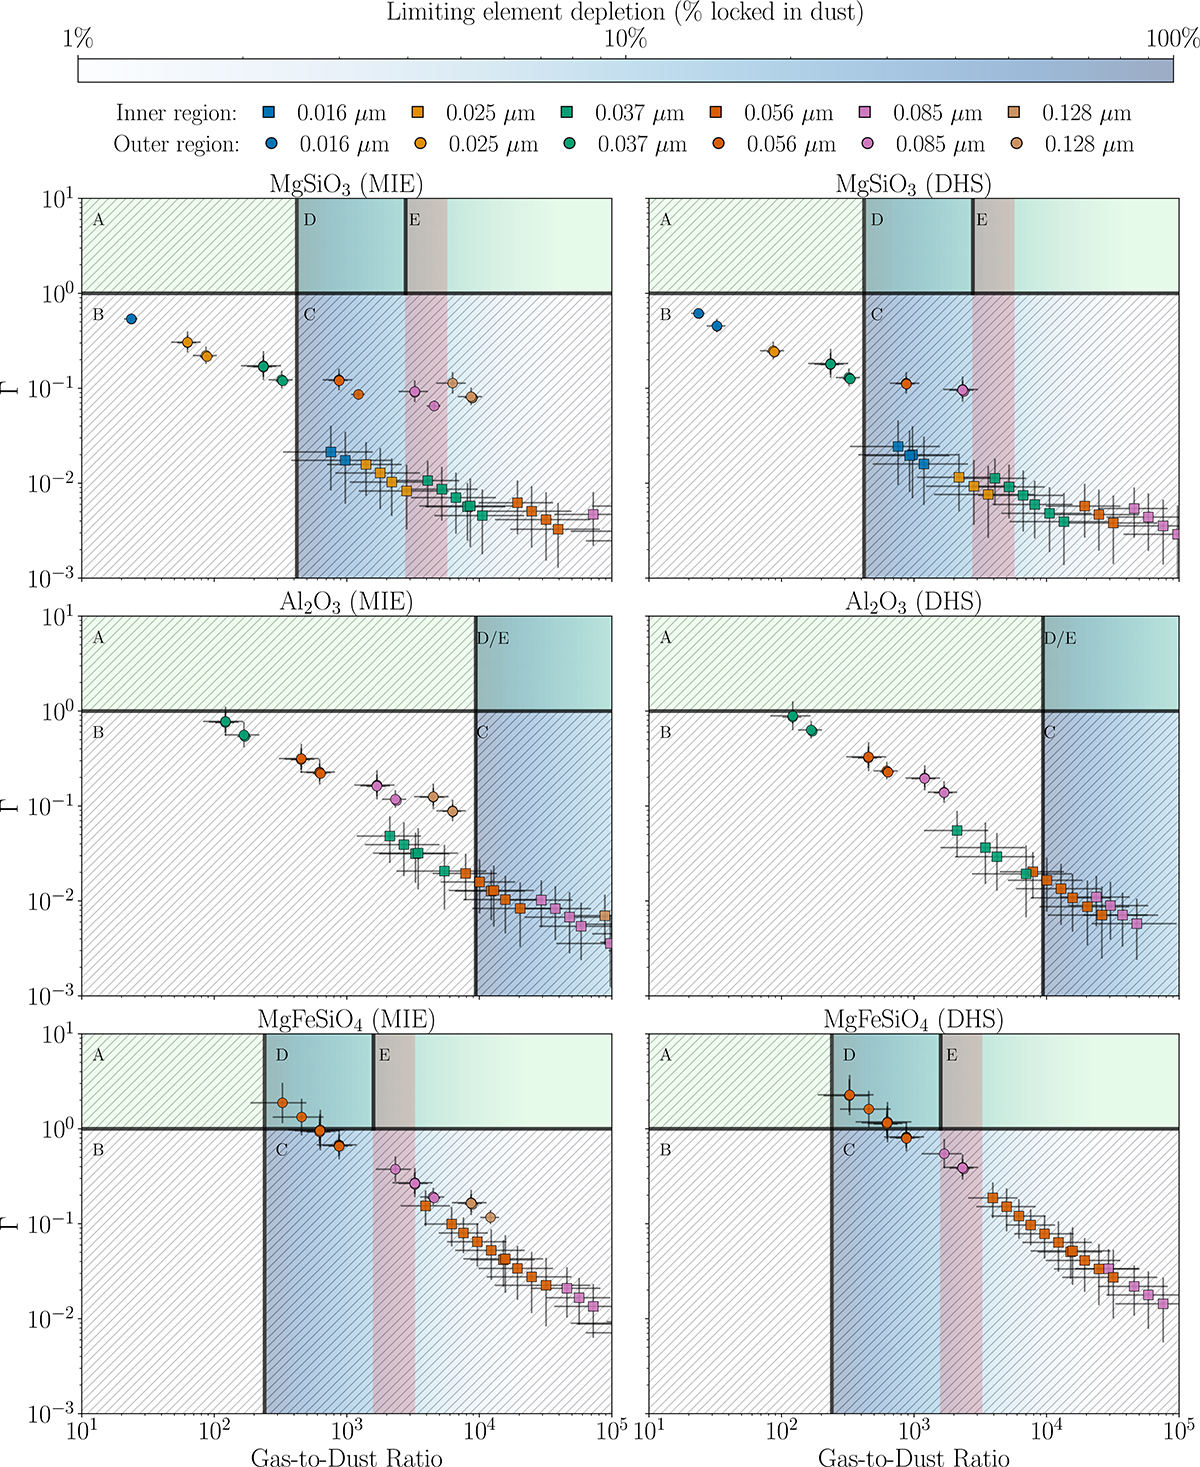
Fig. 5.
Download original image
Radiative-to-gravitational force ratio (Γ) vs gas-to-dust mass ratio for dust models fitting the polarisation observations. Squares and circles denote inner and outer regions (R ≶ 1.6R887 from Khouri et al. 2024); colours indicate grain sizes. Five zones are shown, based on physical viability: (A) Γ > 1 but > 100% elemental depletion is impossible; (B) Γ < 1 and > 100% and depletion is impossible; (C) < 100% depletion but Γ < 1, representing insufficient radiation pressure; (D) Γ > 1 with high but possible depletion inconsistent with observations; and (E) Γ > 1 with observed depletion levels, the ideal wind-driving zone. The horizontal line marks Γ = 1.
Current usage metrics show cumulative count of Article Views (full-text article views including HTML views, PDF and ePub downloads, according to the available data) and Abstracts Views on Vision4Press platform.
Data correspond to usage on the plateform after 2015. The current usage metrics is available 48-96 hours after online publication and is updated daily on week days.
Initial download of the metrics may take a while.