Fig. 1
Download original image
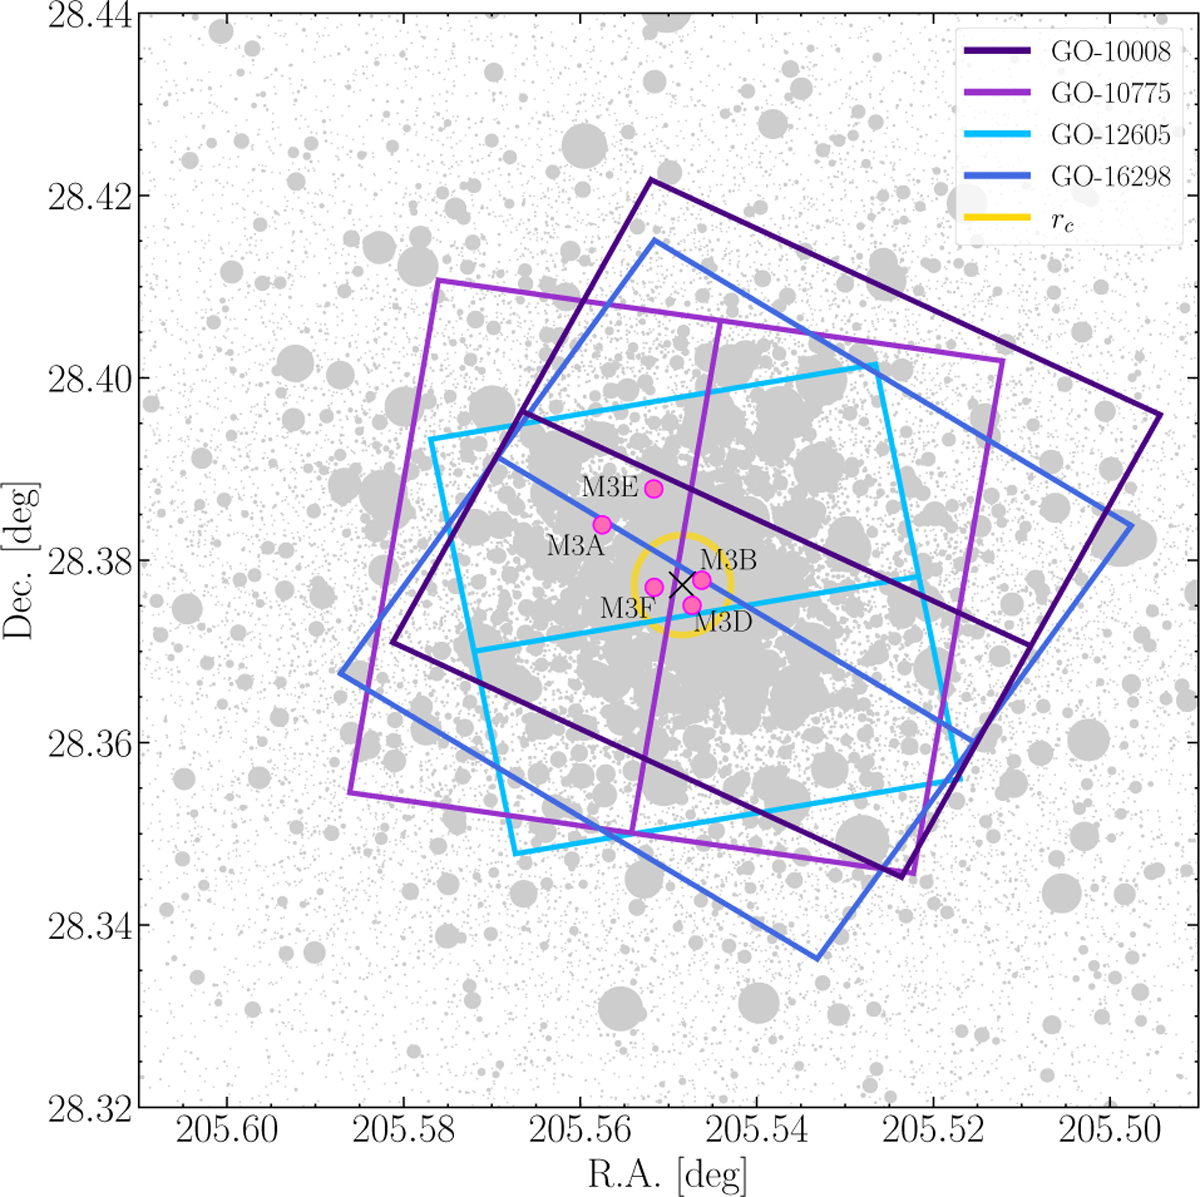
Footprints of the FoVs covered by the HST observations listed in Table 3. The underlying stars come from the Gaia DR3 dataset (Gaia Collaboration 2023) centerd on M3, obtained using the Gaia G-band magnitude to scale the size of the data points. Each FoV is color-coded according to the GO proposal number, listed in Table 3. The pink dots represent the position of each MSP and their name is represented. The black cross marks the center of the cluster (RA=205°.548416, Dec=28°.377277) and the yellow circle is the core radius rc = 0.98 pc. Both values are taken from the 2023 version of the GC catalog provided by Baumgardt et al. (2020, but see also Vasiliev & Baumgardt (2021))2.
Current usage metrics show cumulative count of Article Views (full-text article views including HTML views, PDF and ePub downloads, according to the available data) and Abstracts Views on Vision4Press platform.
Data correspond to usage on the plateform after 2015. The current usage metrics is available 48-96 hours after online publication and is updated daily on week days.
Initial download of the metrics may take a while.