Fig. 11
Download original image
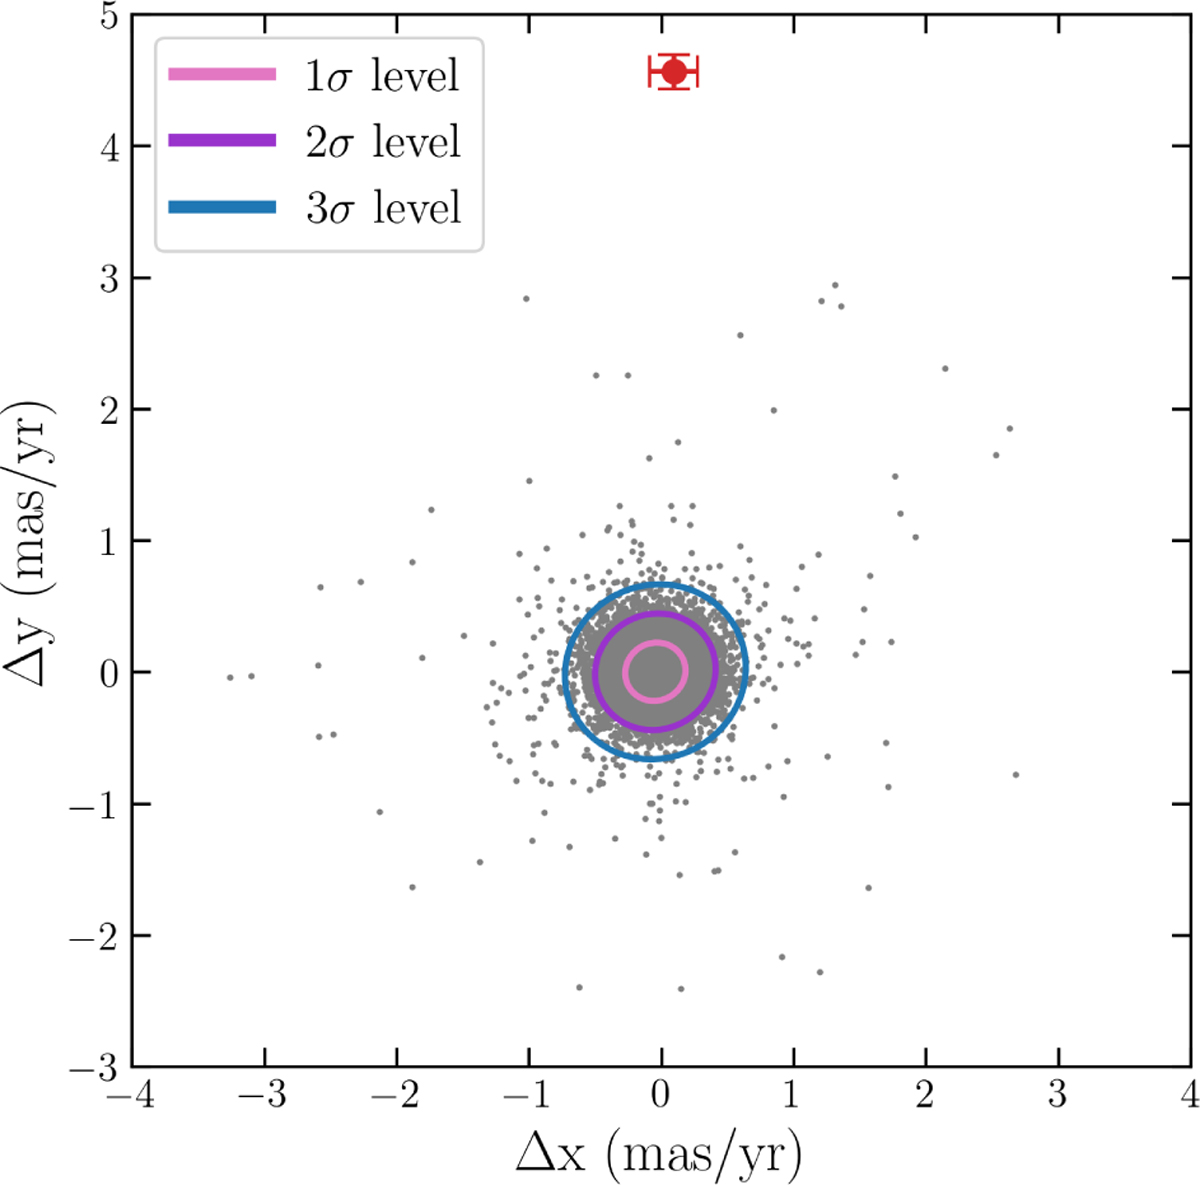
Vector point diagram showing the proper motion displacements in x and y for all stars common to the HST datasets from proposals 10775 and 16298 (gray points). The red dot marks the position and uncertainty of the object at the M3E radio position. The 1σ, 2σ, and 3σ contours, representing the modeled cluster PM distribution, are shown for reference. The distribution was modeled with a two-dimensional Gaussian mixture model (GMM) using a single component, implemented via the XDGMM Python framework (Holoien et al. 2017).
Current usage metrics show cumulative count of Article Views (full-text article views including HTML views, PDF and ePub downloads, according to the available data) and Abstracts Views on Vision4Press platform.
Data correspond to usage on the plateform after 2015. The current usage metrics is available 48-96 hours after online publication and is updated daily on week days.
Initial download of the metrics may take a while.