Fig. 4
Download original image
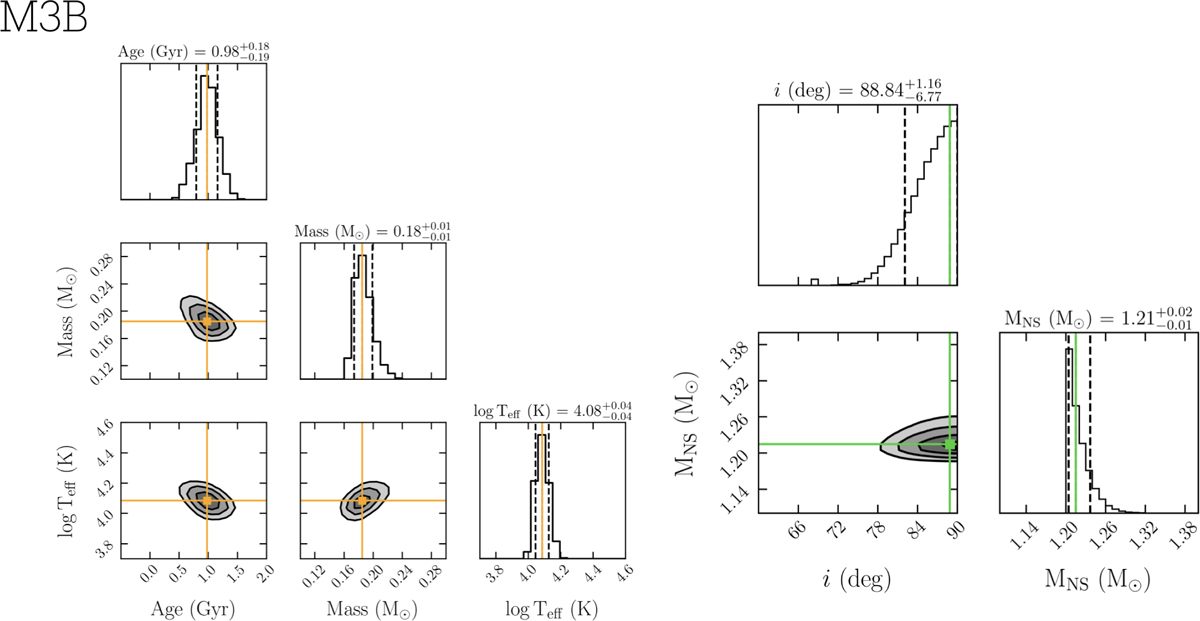
Left-hand corner plots: Constraints on the mass, cooling age, and effective temperature of the companion star to M3B are presented. The 1D histograms show the marginalized likelihood distributions for each parameter, with the solid orange and dashed black lines indicating the 50th, 16th, and 84th percentiles, respectively. These percentiles represent the best-fit values and associated uncertainties. In the 2D histograms, contours correspond to the 1σ, 2σ, and 3σ levels, with the best-fit values marked by orange points and lines. The derived values for mass, cooling age, and temperature are reported at the top of each 1D distribution panel. Right-hand corner plot: Constraints on the NS mass and the orbital inclination angle of M3B. The one-dimensional histograms represent the marginalized probability distributions for these two parameters, with the solid green and dashed black lines indicating the best-fit values and their associated uncertainties. The bottom-left panel shows the joint two-dimensional posterior probability distribution, with contours representing the 1σ, 2σ, and 3σ confidence levels.
Current usage metrics show cumulative count of Article Views (full-text article views including HTML views, PDF and ePub downloads, according to the available data) and Abstracts Views on Vision4Press platform.
Data correspond to usage on the plateform after 2015. The current usage metrics is available 48-96 hours after online publication and is updated daily on week days.
Initial download of the metrics may take a while.