Fig. 1.
Download original image
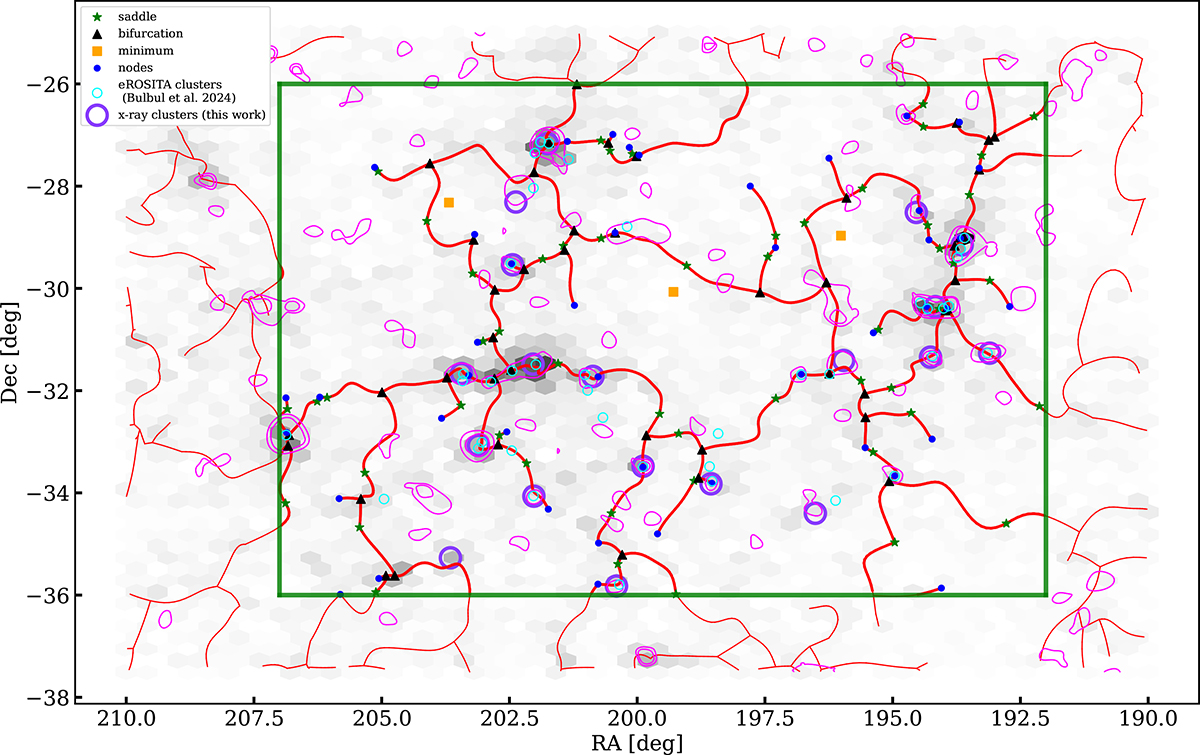
Large-scale structure identification using DisPerSE in two dimensions within the SSC. Greyscale hexagons show the density map of photometric members in the supercluster. Red lines indicate optically detected filaments, while different symbols correspond to critical points (see legend). Large-scale X-ray detections in the SSC area are in magenta contours. The cyan circles indicate clusters detected in the 0.2–2.3 keV as extended X-ray sources in the Shapley area and z range considered for this work (Bulbul et al. 2024), while purple circles are the large-scale emission in the band 0.6–2.3 identified as galaxy clusters used in this work. Green rectangle indicates the CHANCES coverage in SSC and the area considered for the optical-X-ray comparative analysis shown in Sect. 4.
Current usage metrics show cumulative count of Article Views (full-text article views including HTML views, PDF and ePub downloads, according to the available data) and Abstracts Views on Vision4Press platform.
Data correspond to usage on the plateform after 2015. The current usage metrics is available 48-96 hours after online publication and is updated daily on week days.
Initial download of the metrics may take a while.