Fig. 3.
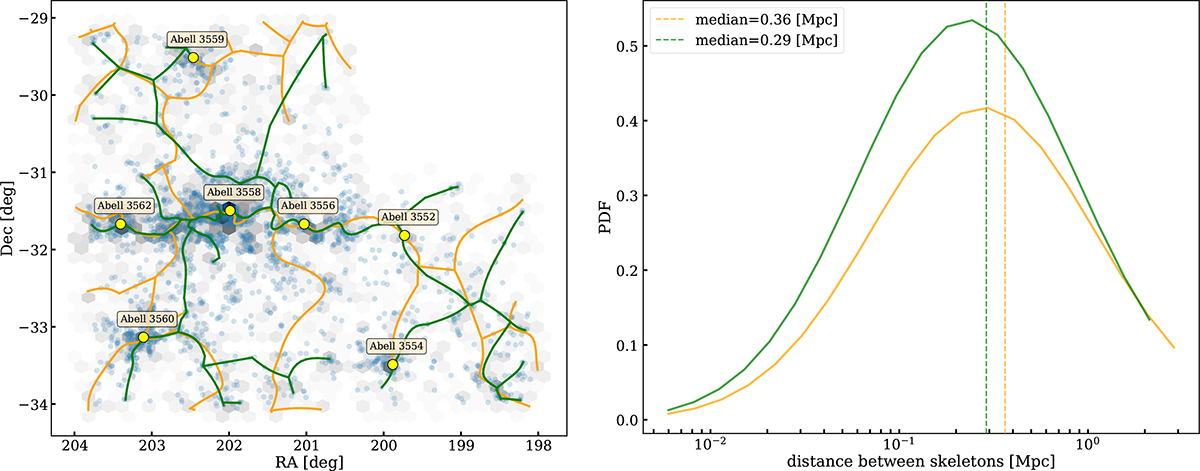
Download original image
Left: Two-dimensional reconstruction of the filament network using the spectroscopic sample (green segments) and photometric members (red segments) in the SSC core. The gray map indicates the density of photometric members in the area, while blue circles are the spectral members. Orange circles indicate known X-ray clusters in the SSC (Haines et al. 2018). Right: Probability distribution of the distances between skeletons of filament networks from photometric to spectroscopic (orange curve) and spectroscopic to photometric (green curve) members within the ShaSS area. Vertical dashed orange and green lines show the median distance between skeletons obtained from the two comparisons.
Current usage metrics show cumulative count of Article Views (full-text article views including HTML views, PDF and ePub downloads, according to the available data) and Abstracts Views on Vision4Press platform.
Data correspond to usage on the plateform after 2015. The current usage metrics is available 48-96 hours after online publication and is updated daily on week days.
Initial download of the metrics may take a while.