Fig. 4.
Download original image
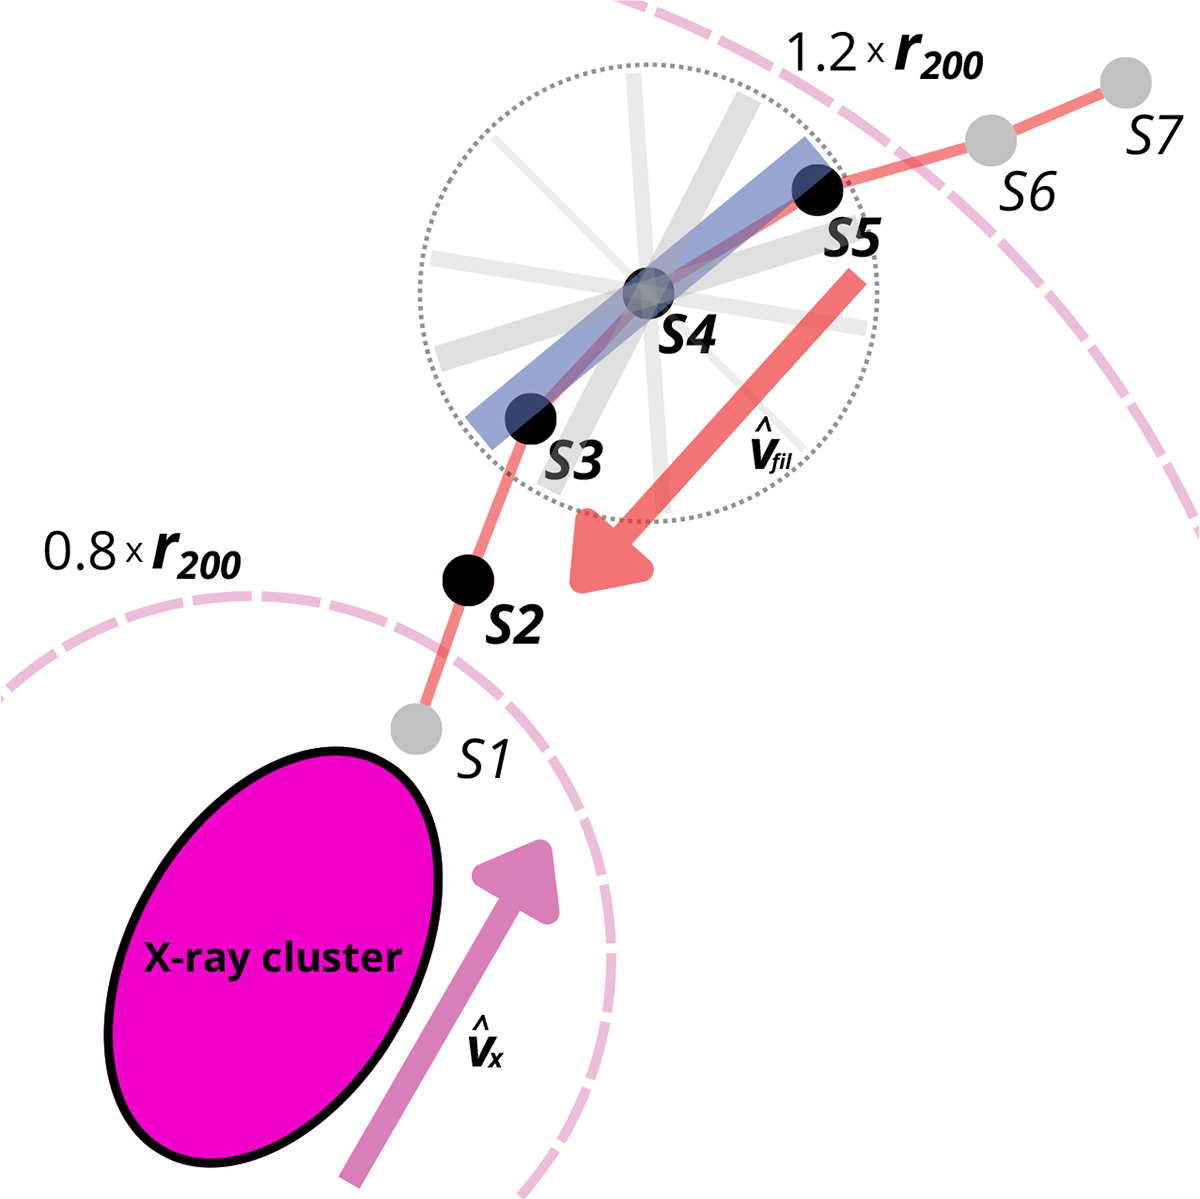
Schematic representation of the definition of filament segments connected to the X-ray cluster and the computation of their projected inclinations using the PHT technique. Red circles indicate the segment points [S1, S2, ..., S7] that are part of the detected filament network. Dashed magenta lines represent 0.8 and 1.2 times the r200 around the X-ray peak, respectively. Dark red segment points [S2, S3, S4, S5], located between the dashed curves, are used to compute the mean projected inclination of the filament segment connected to the galaxy cluster (magenta ellipse). The PHT operator is centered at the position of S4, with each line representing a possible local alignment angle of the segment points, based on the positions of the points within the dashed circumference. Line thickness corresponds to the probability of alignment at that specific angle, with the thickest blue line denoting the most probable inclination angle at S4. The same procedure is applied at S2, S3 and S5 to ultimately compute the mean projected alignment angle using Eq. (2), represented as the red vector ![]() . The inclination angle of the X-ray cluster is represented as the magenta vector
. The inclination angle of the X-ray cluster is represented as the magenta vector ![]()
Current usage metrics show cumulative count of Article Views (full-text article views including HTML views, PDF and ePub downloads, according to the available data) and Abstracts Views on Vision4Press platform.
Data correspond to usage on the plateform after 2015. The current usage metrics is available 48-96 hours after online publication and is updated daily on week days.
Initial download of the metrics may take a while.