Fig. 5.
Download original image
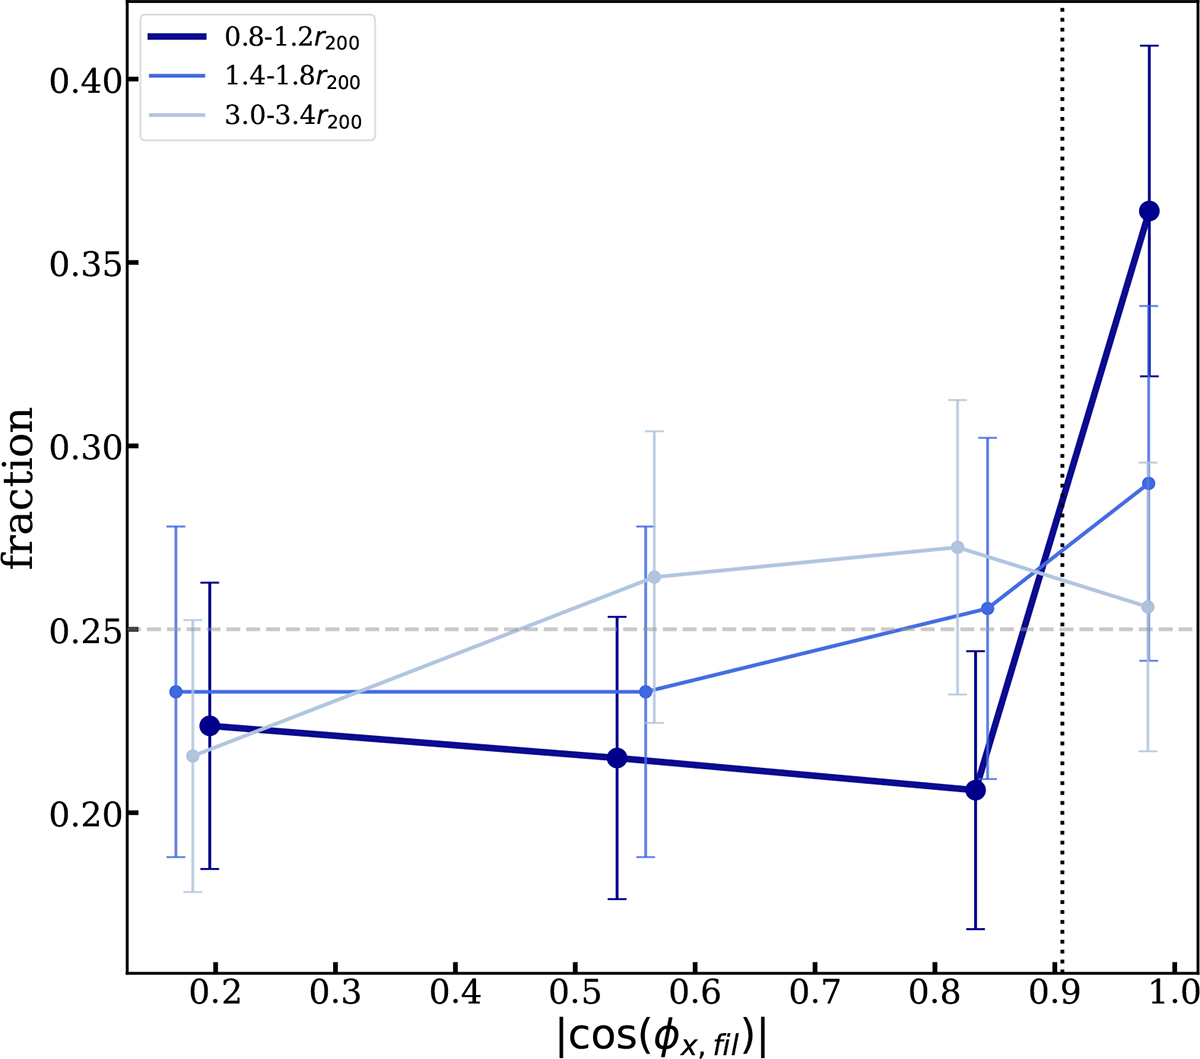
Distribution of the alignment between optical filaments connected to galaxy clusters and the major axis of each cluster as inferred from its X-ray emission. Fractions and 68% confidence intervals were computed in equal-sized angular bins, following the method described in Damsted et al. (2023). Different colors indicate different projected cluster–filament distances used to compute the projected filament inclination. The gray-dashed horizontal line represents the uniform distribution, while the black-dotted vertical line indicates an alignment threshold of less than 25 degrees.
Current usage metrics show cumulative count of Article Views (full-text article views including HTML views, PDF and ePub downloads, according to the available data) and Abstracts Views on Vision4Press platform.
Data correspond to usage on the plateform after 2015. The current usage metrics is available 48-96 hours after online publication and is updated daily on week days.
Initial download of the metrics may take a while.