Fig. 3.
Download original image
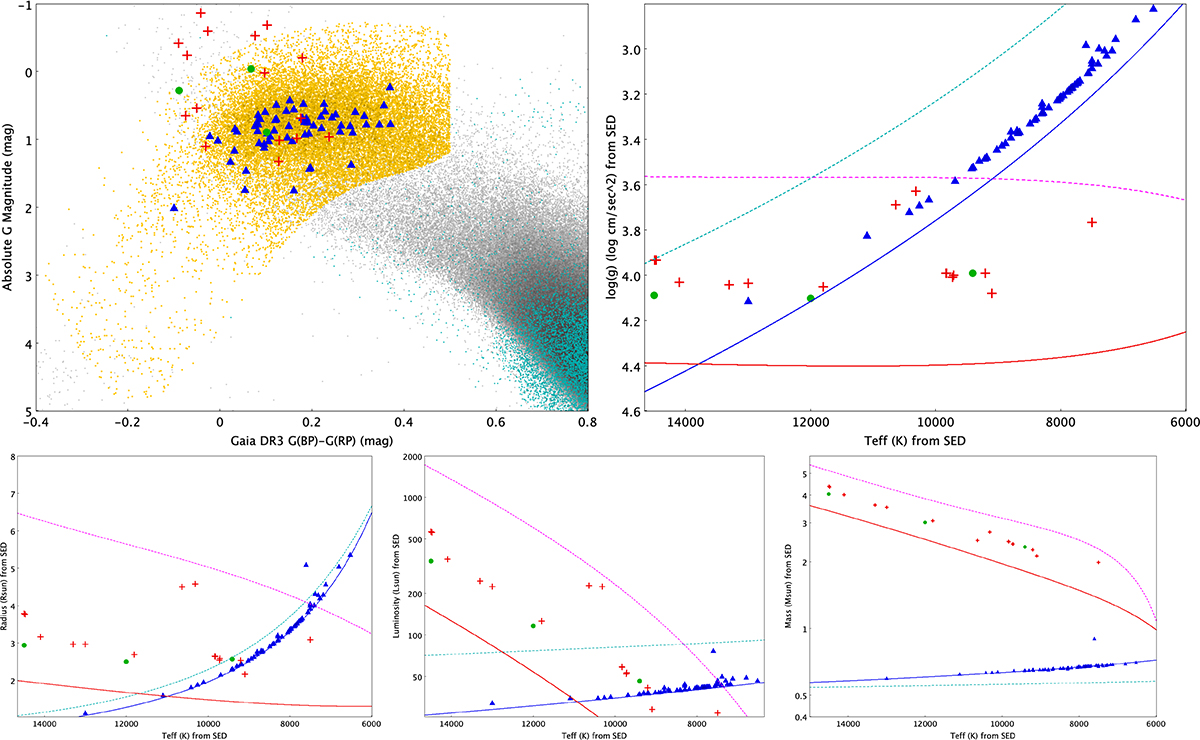
Upper left panel: Gaia DR3 CMD for 30 000 randomly selected objects with parallax errors of less than 10% (grey dots), and the subset with tangential velocities greater than 145 km s−1 typical for halo stars (cyan dots). C24 BHB candidates (yellow dots). Upper right panel: Teff − log g (Kiel) plot. Bottom left panel: Teff − R plot. Bottom middle panel: Teff − L plot. Bottom right panel: Teff − M plot for the 89 BHB candidates listed in Appendix A. All panels: Targets confirmed as BHBs using Ondřejov spectra and SEDs (blue triangles), and targets confirmed as MS stars using Ondřejov spectra and SEDs (red crosses), targets with low rotational velocities from Ondřejov spectra but with MS stellar and atmospheric parameters from SED evaluation (green circles). All of the plots showing Teff on the X axis have the ZAMS (solid red), TAMS (dotted magenta), ZAHB (solid blue) and TAHB (dotted cyan) lines presented.
Current usage metrics show cumulative count of Article Views (full-text article views including HTML views, PDF and ePub downloads, according to the available data) and Abstracts Views on Vision4Press platform.
Data correspond to usage on the plateform after 2015. The current usage metrics is available 48-96 hours after online publication and is updated daily on week days.
Initial download of the metrics may take a while.