Fig. 1
Download original image
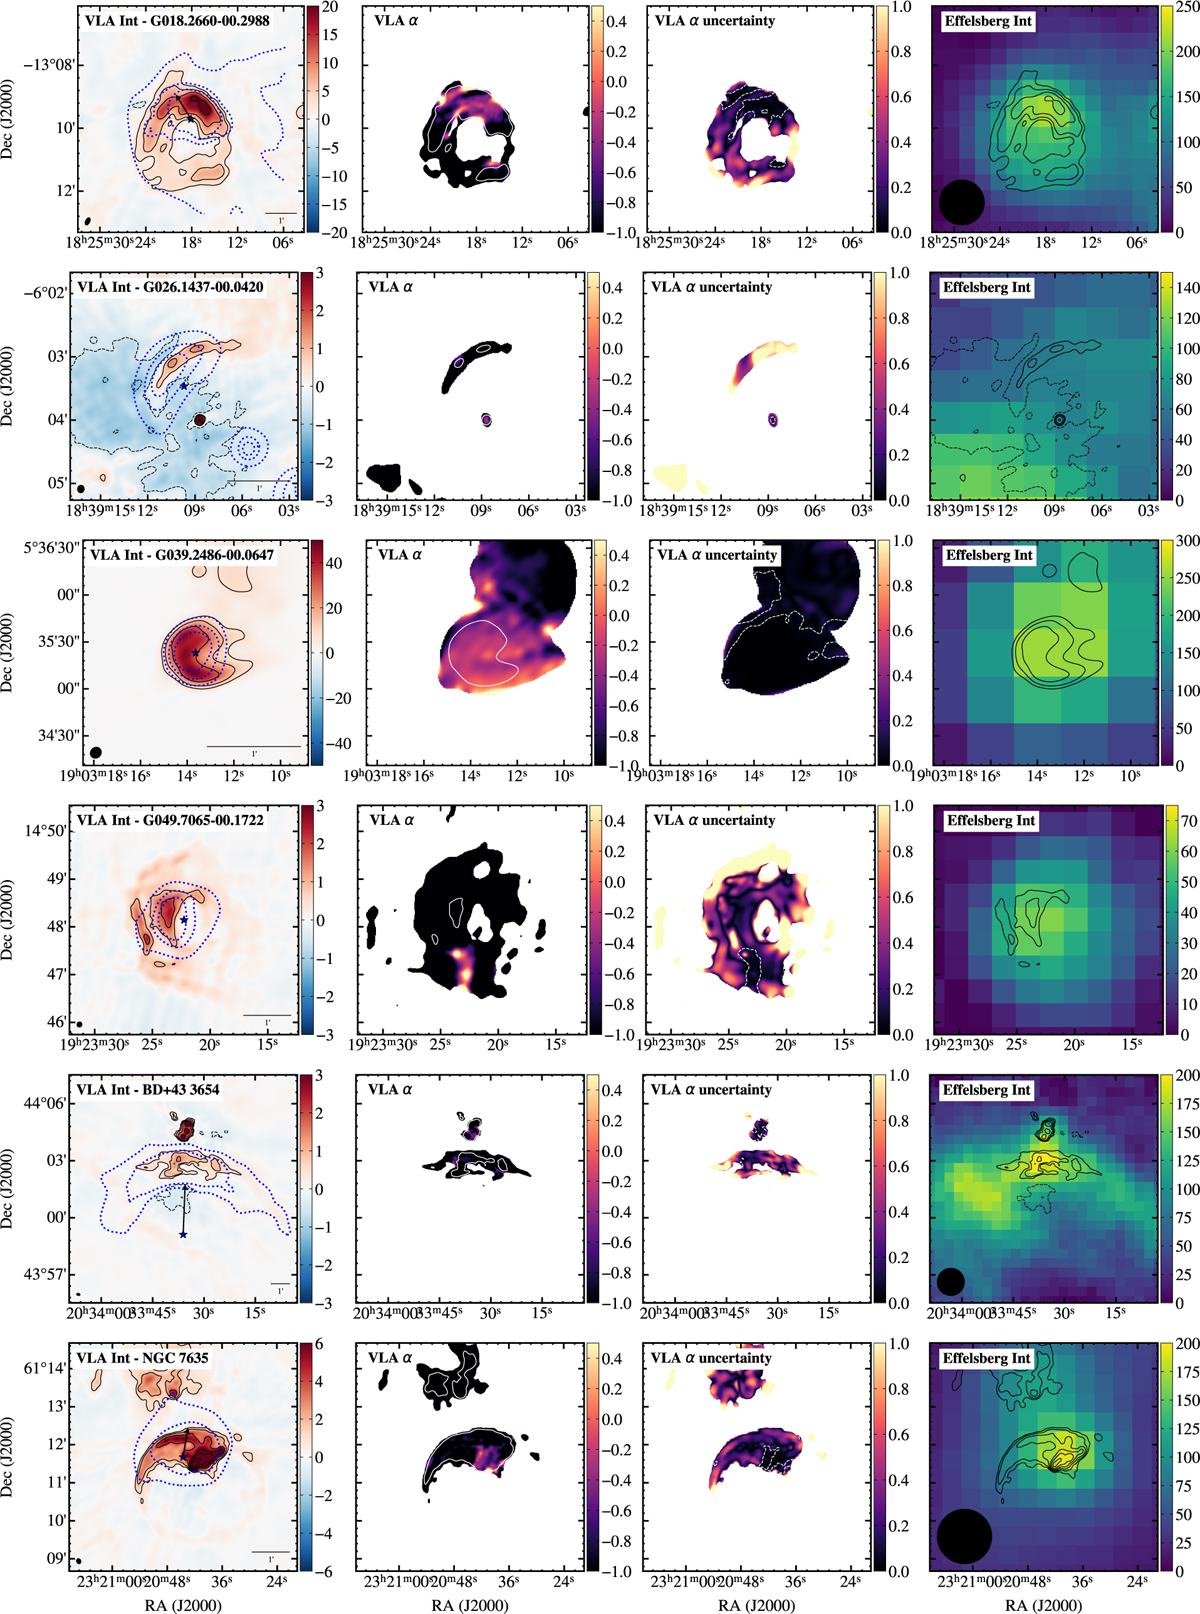
Presentation of the detected targets listed in Table A.1. Each row shows a single target, labelled in the title of the first column. From left to right, the panels show (1) the VLA intensity map in mJy beam-1 with black contours at [–10, –5,5,10,20,40,80,160] σ; (2) the map of the powerlaw spectral index, α, with 10 σ intensity contour overlaid; (3) the map of the l-σ absolute uncertainty in α, with a contour showing α = –0.5; and (4) the Effelsberg intensity map at 7.639 GHz (colour scale in mJy beam-1) with VLA intensity contours overlaid and the beamsize shown for cases where it is not too large (in all cases, about 3 pixels in diameter). Also shown in the first panel are a line showing 1' scale at the bottom right, the synthetic beam FWHM at bottom left, blue dotted contours of WISE 22 pm emission, and a black arrow showing the direction of peculiar proper motion, where reliably estimated.
Current usage metrics show cumulative count of Article Views (full-text article views including HTML views, PDF and ePub downloads, according to the available data) and Abstracts Views on Vision4Press platform.
Data correspond to usage on the plateform after 2015. The current usage metrics is available 48-96 hours after online publication and is updated daily on week days.
Initial download of the metrics may take a while.