Fig. 3
Download original image
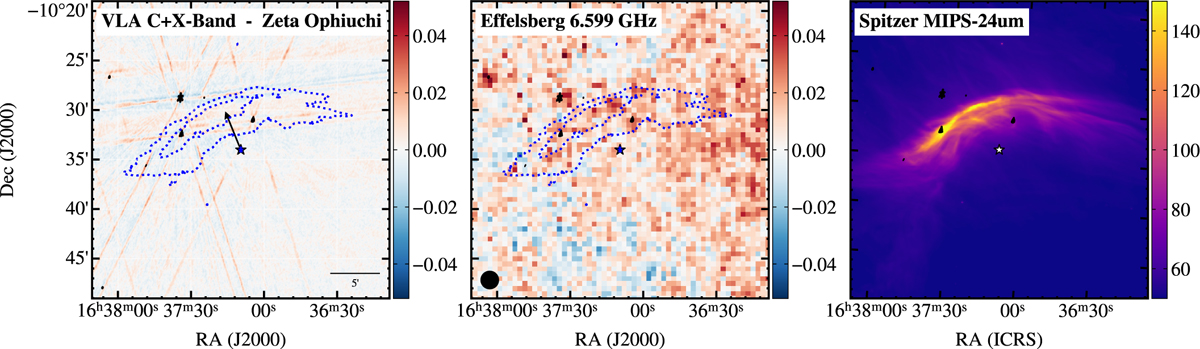
Comparison of observations of the bow shock of ζ Oph with the VLA (left), Effelsberg (centre), and the mid-IR image from Spitzer Space Telescope MIPS 24 µm. All three images are plotted in units of megaJansky per steradian. The VLA and Effelsberg beams are plotted at the lower-left of the respective panels. For the VLA and Effelsberg plots, IR emission contours at levels 70 and 100 MJy sr−1 are overplotted in dotted blue lines, and for Effelsberg and Spitzer plots the VLA intensity contours are overlaid in black, showing only the detected point sources.
Current usage metrics show cumulative count of Article Views (full-text article views including HTML views, PDF and ePub downloads, according to the available data) and Abstracts Views on Vision4Press platform.
Data correspond to usage on the plateform after 2015. The current usage metrics is available 48-96 hours after online publication and is updated daily on week days.
Initial download of the metrics may take a while.