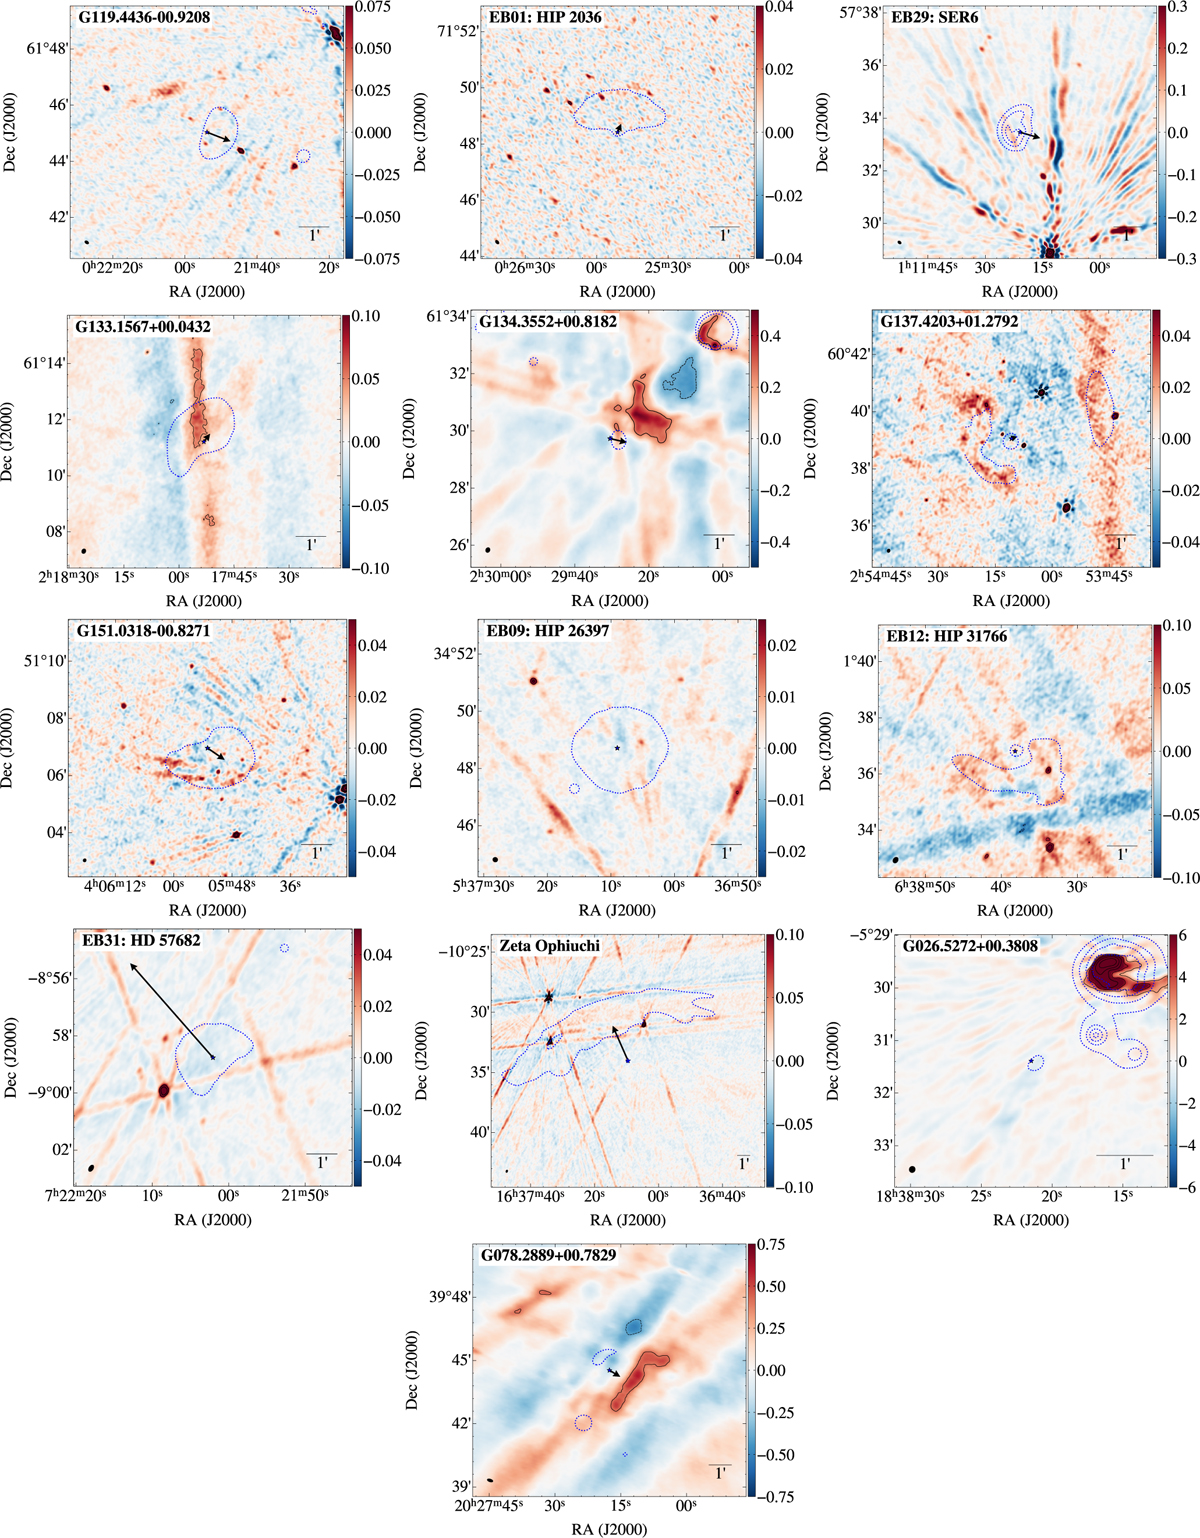
Fig. C.1
Download original image
Intensity plots of the non-detected targets listed in Table A.1. We use a saturated colour scale extending to negative values to show the noise level in the maps. The colour bar values are in milliJansky per beam. In the bottom right, a line that corresponds to 1′ is shown, while in the bottom left, the cross-section of the synthetic beam’s FWHM can be seen. Contours of the most interesting features from the WISE 22 μm counterpart are overlaid with blue lines.
Current usage metrics show cumulative count of Article Views (full-text article views including HTML views, PDF and ePub downloads, according to the available data) and Abstracts Views on Vision4Press platform.
Data correspond to usage on the plateform after 2015. The current usage metrics is available 48-96 hours after online publication and is updated daily on week days.
Initial download of the metrics may take a while.