Fig. 3
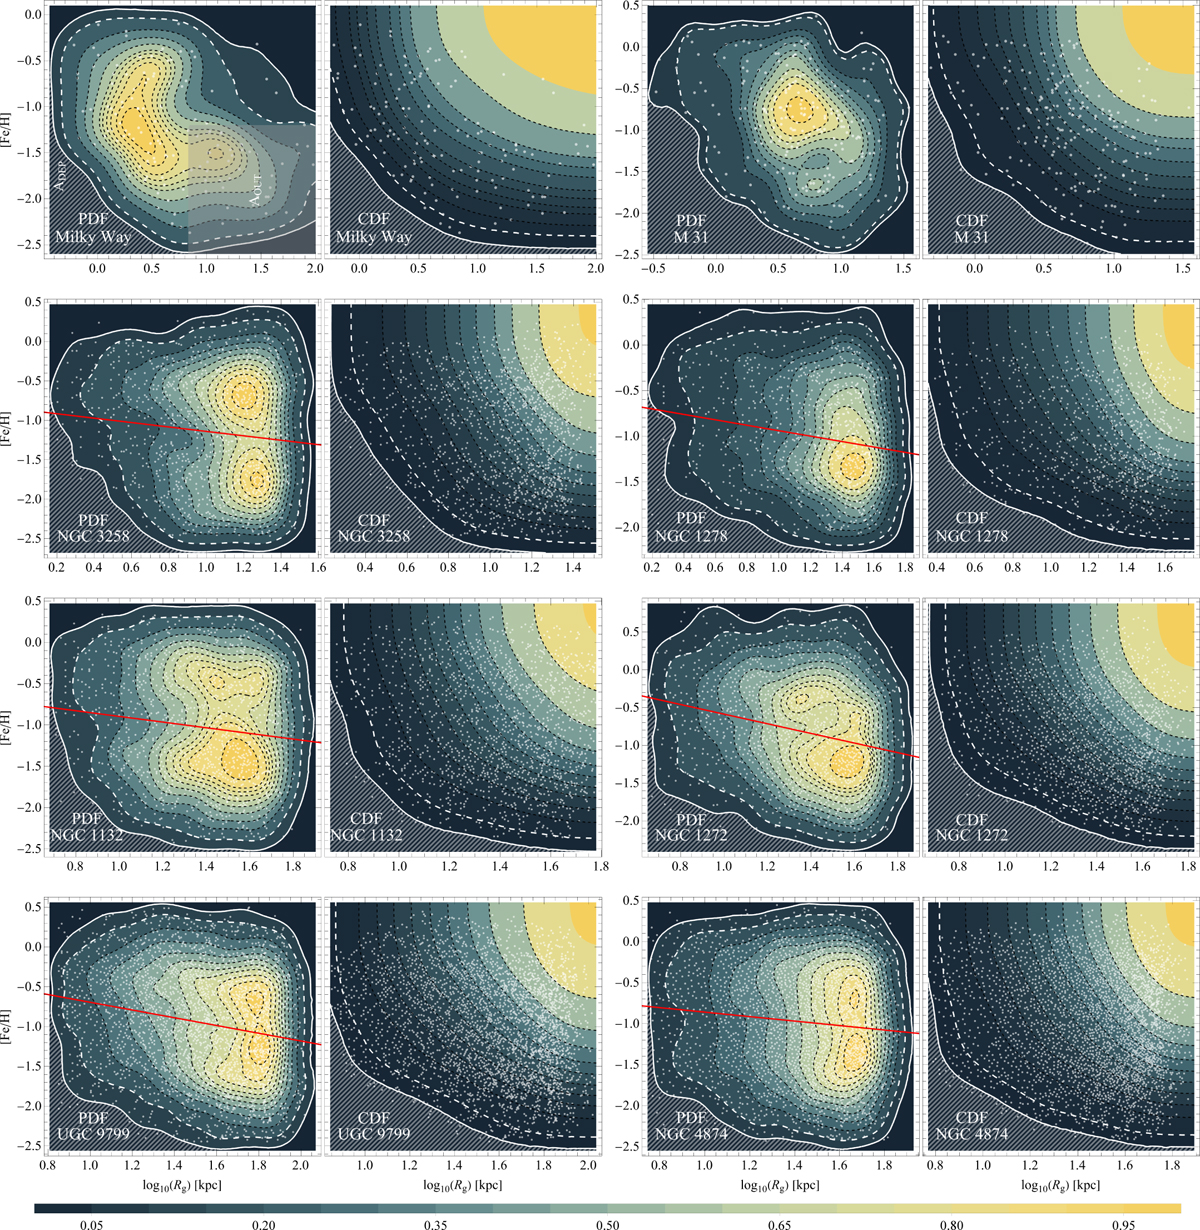
Download original image
CDFs and scaled PDFs for eight galaxies in the Rg-[Fe/H] parameter space. Dashed isodensity contours represent boundaries enclosing 5–95% of all data in 10% increments. White contours (dashed for 95% and solid for 99%, respectively) mark outer boundaries. Gray dots denote the distribution of GCs in each host galaxy. The hatched area highlights the depleted region of metal-poor GCs (ADEP), while the shaded area in the MW panel indicates the outer non-depleted region (AOUT; see Section 3.2). Red solid lines show the least-squares fitted metallicity gradient (Harris 2023; see Section 3.5). The CDFs are derived from the clustering results of the DBSCAN algorithm, with low-density regions excluded and classified as noise.
Current usage metrics show cumulative count of Article Views (full-text article views including HTML views, PDF and ePub downloads, according to the available data) and Abstracts Views on Vision4Press platform.
Data correspond to usage on the plateform after 2015. The current usage metrics is available 48-96 hours after online publication and is updated daily on week days.
Initial download of the metrics may take a while.