Fig. 4
Download original image
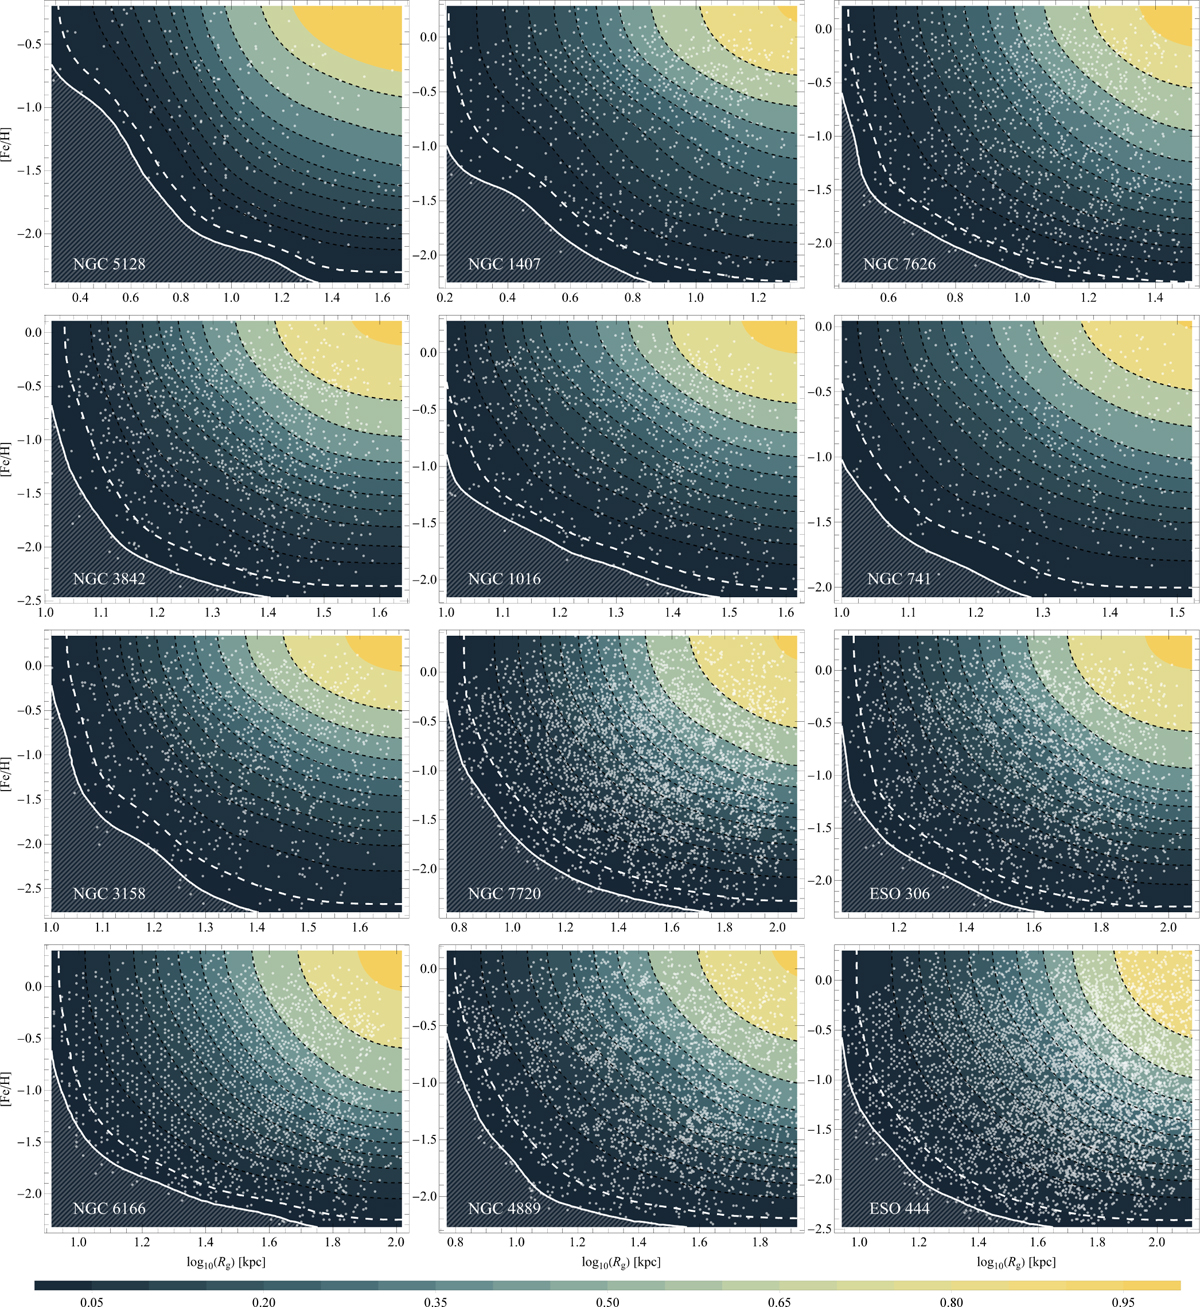
CDFs for nine galaxies in the Rg–[Fe/H] parameter space, plotted from clustering results obtained via the DBSCAN algorithm. Contours are plotted similarly to those in Figure 3. The white contours mark boundaries that encompass 95 and 99% of the data, highlighting regions with very low probabilities of finding GCs, corresponding to approximate CDF values of 0.01 and 0.002. The hatched area highlights the depleted region of metal-poor GCs.
Current usage metrics show cumulative count of Article Views (full-text article views including HTML views, PDF and ePub downloads, according to the available data) and Abstracts Views on Vision4Press platform.
Data correspond to usage on the plateform after 2015. The current usage metrics is available 48-96 hours after online publication and is updated daily on week days.
Initial download of the metrics may take a while.