Fig. 10.
Download original image
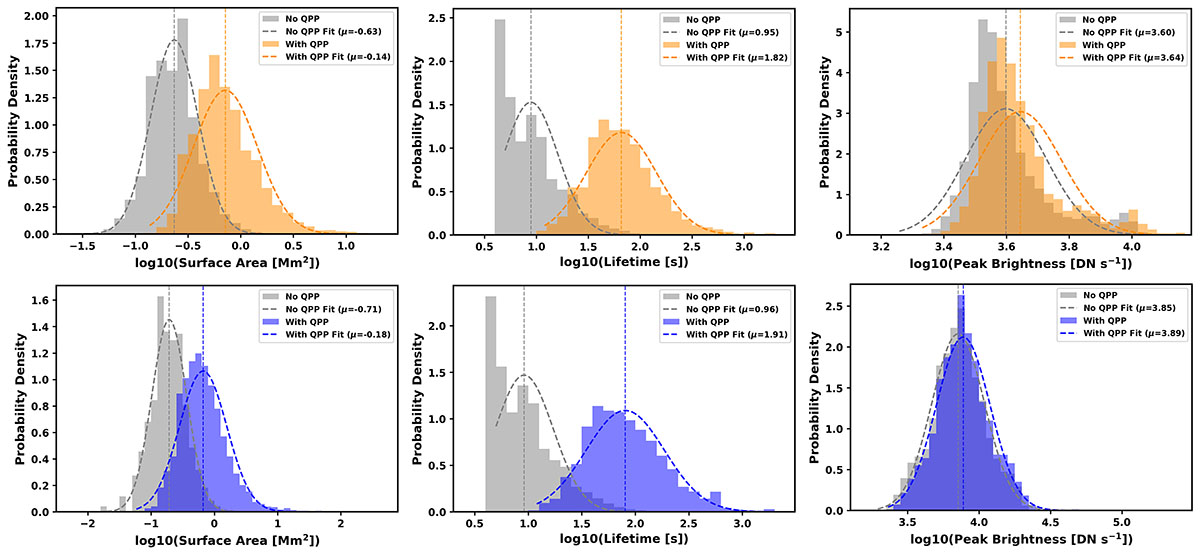
Probability density distributions of three parameters: surface area (left), lifetime (middle), and peak brightness (right), for EUV brightenings with (orange or blue) and without (grey) detected QPPs. The top row corresponds to QS brightenings and the bottom row to AR brightenings. The distributions are shown in log-scale for each parameter. Overplotted dashed curves represent Gaussian fits to each distribution, with vertical dashed lines indicating the mean values (μ) from the fits.
Current usage metrics show cumulative count of Article Views (full-text article views including HTML views, PDF and ePub downloads, according to the available data) and Abstracts Views on Vision4Press platform.
Data correspond to usage on the plateform after 2015. The current usage metrics is available 48-96 hours after online publication and is updated daily on week days.
Initial download of the metrics may take a while.