Fig. 12.
Download original image
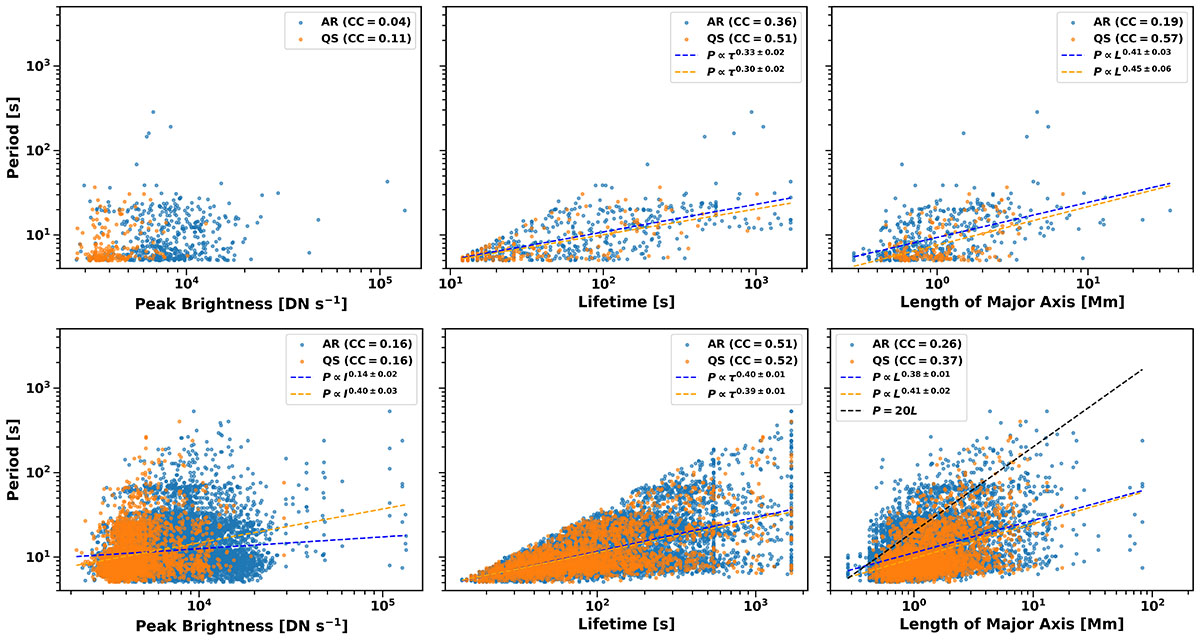
Scatter plots showing the relationships between the QPP period (P) and the peak brightness (I), lifetime (τ), and major axis length (L) of EUV brightenings in AR (blue) and QS (orange) regions. The top panels correspond to stationary QPPs, while the bottom panels show non-stationary QPPs. Pearson correlation coefficients (CC) for ARs and the QS are indicated in each panel. For cases where the linear regression analysis yields a statistically significant result (p-value < 0.05), the corresponding fit is shown as a dashed line, and the power-law exponent is annotated in the panel.
Current usage metrics show cumulative count of Article Views (full-text article views including HTML views, PDF and ePub downloads, according to the available data) and Abstracts Views on Vision4Press platform.
Data correspond to usage on the plateform after 2015. The current usage metrics is available 48-96 hours after online publication and is updated daily on week days.
Initial download of the metrics may take a while.