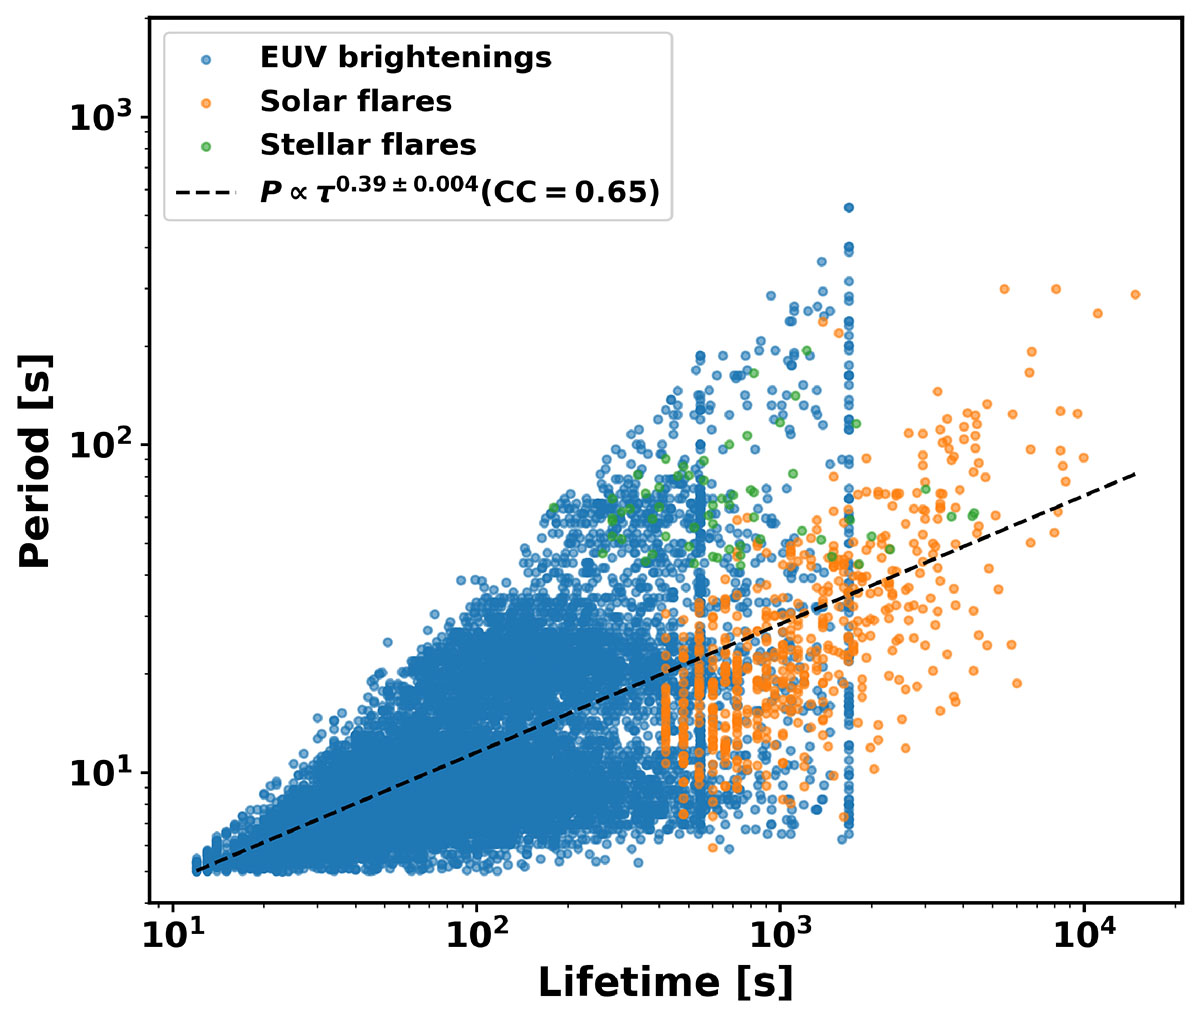
Fig. 13.
Download original image
Relationship between QPP period (P) and lifetime (τ) across different flare scales. Blue, orange, and green dots represent QPPs detected in EUV brightenings (this study), GOES X-ray solar flares (Hayes et al. 2020), and TESS stellar flares (Joshi et al. 2025), respectively. The dashed black line shows a power-law fit to the combined dataset.
Current usage metrics show cumulative count of Article Views (full-text article views including HTML views, PDF and ePub downloads, according to the available data) and Abstracts Views on Vision4Press platform.
Data correspond to usage on the plateform after 2015. The current usage metrics is available 48-96 hours after online publication and is updated daily on week days.
Initial download of the metrics may take a while.