Open Access
Fig. A.1.
Download original image
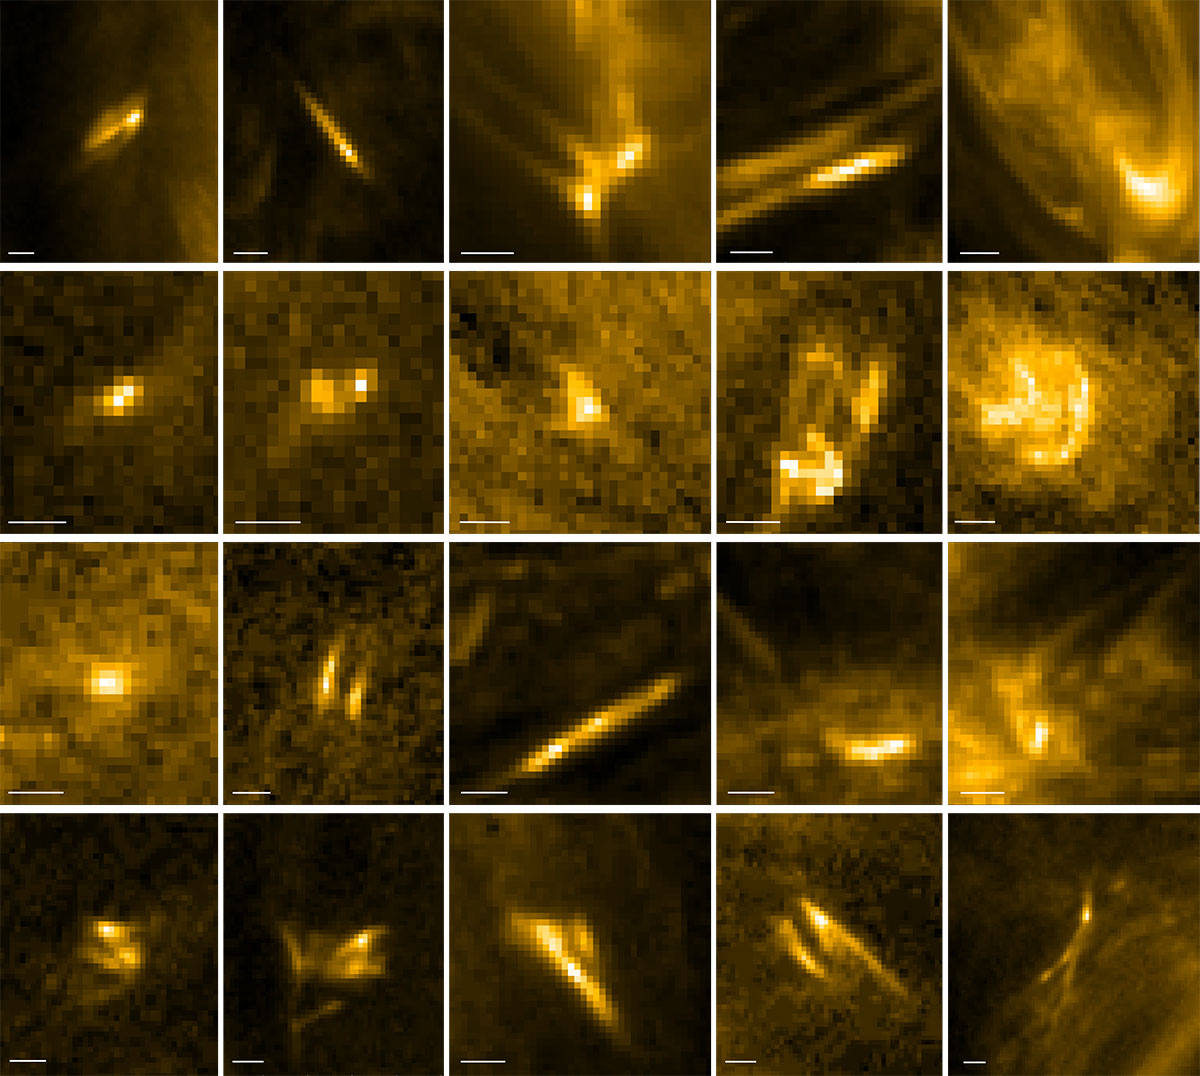
Additional examples of 20 EUV brightenings, with five events shown from each dataset. Top row: AR on 19 October 2024. Second row: QS on 19 October 2024. Third row: AR on 19 March 2025. Bottom row: QS on 19 March 2025. The white solid line denotes 1 Mm.
Current usage metrics show cumulative count of Article Views (full-text article views including HTML views, PDF and ePub downloads, according to the available data) and Abstracts Views on Vision4Press platform.
Data correspond to usage on the plateform after 2015. The current usage metrics is available 48-96 hours after online publication and is updated daily on week days.
Initial download of the metrics may take a while.