Open Access
Fig. 2.
Download original image
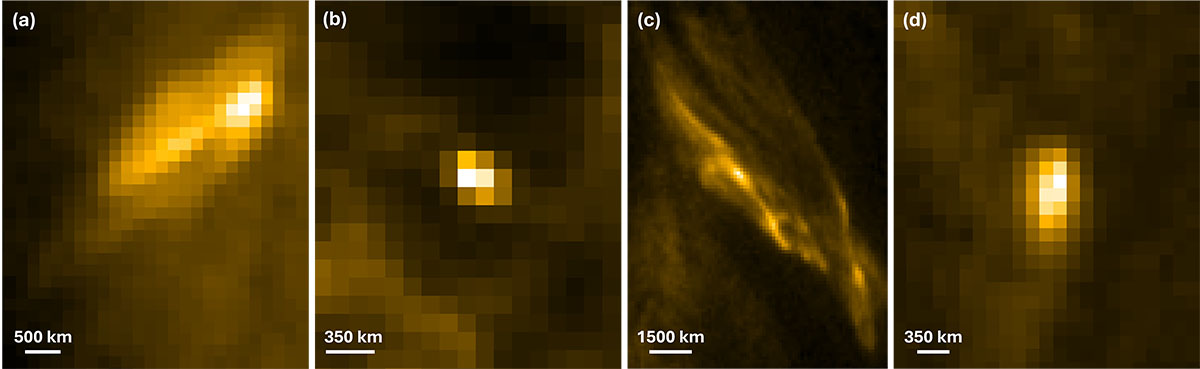
Examples of the detected EUV brightenings. Panels (a) and (b) show events observed in an AR on 19 October 2024, while panels (c) and (d) show events observed in the QS on 19 March 2025. In each case, the image corresponds to the time of peak brightness of the event.
Current usage metrics show cumulative count of Article Views (full-text article views including HTML views, PDF and ePub downloads, according to the available data) and Abstracts Views on Vision4Press platform.
Data correspond to usage on the plateform after 2015. The current usage metrics is available 48-96 hours after online publication and is updated daily on week days.
Initial download of the metrics may take a while.