Open Access
Fig. 3.
Download original image
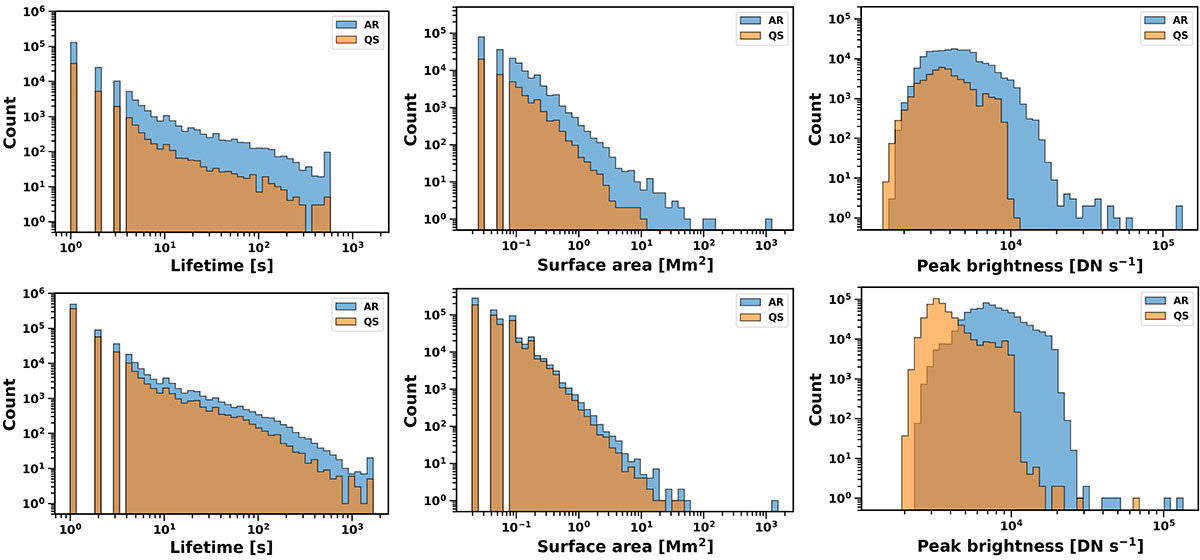
Logarithmic histograms of EUV brightening properties. The panels show the lifetime (left), surface area (middle), and peak brightness (right) for events detected on 19 October 2024 (top) and 19 March 2025 (bottom). Events detected in ARs and the QS regions are shown in blue and orange, respectively.
Current usage metrics show cumulative count of Article Views (full-text article views including HTML views, PDF and ePub downloads, according to the available data) and Abstracts Views on Vision4Press platform.
Data correspond to usage on the plateform after 2015. The current usage metrics is available 48-96 hours after online publication and is updated daily on week days.
Initial download of the metrics may take a while.