Fig. 5.
Download original image
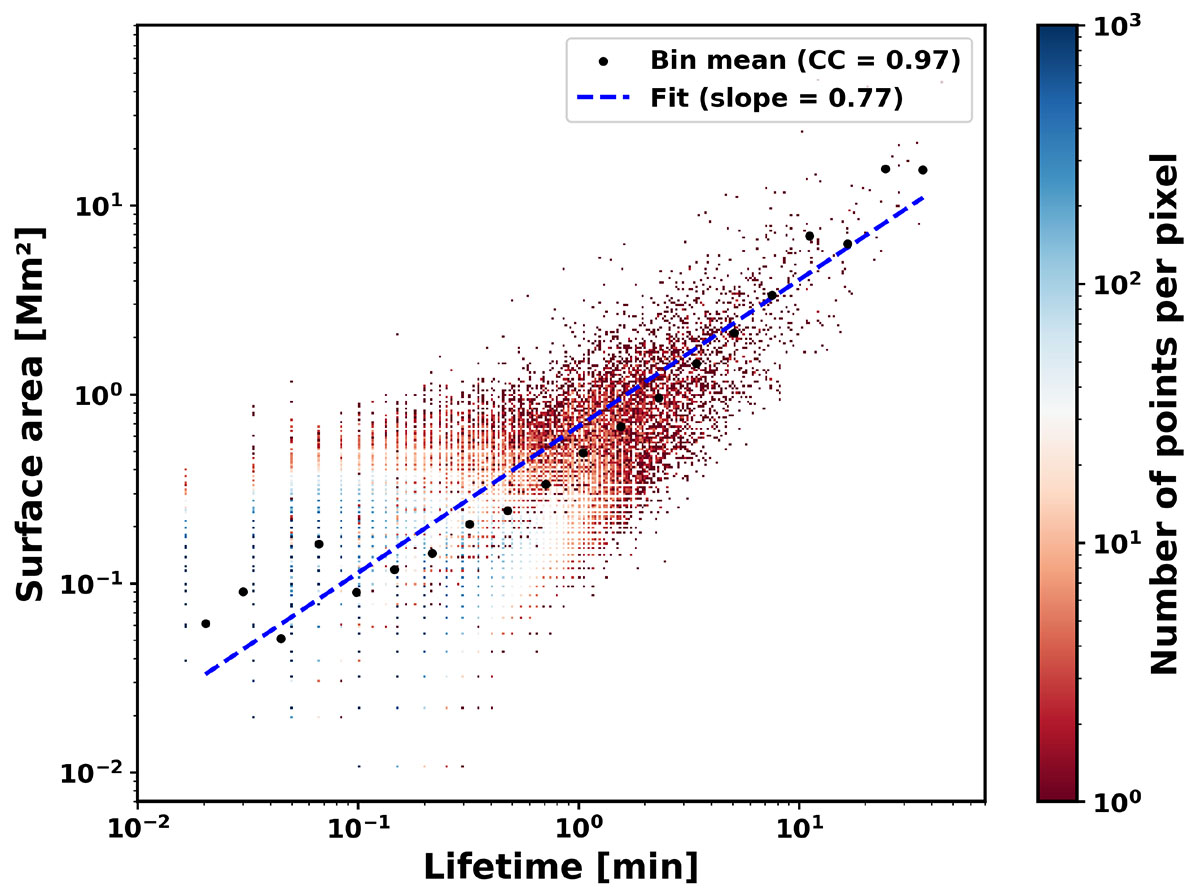
Scatter density maps showing the relationship between the lifetimes and surface areas of QS EUV brightenings detected in this study, combined with the events reported in Narang et al. (2025). The colour scale indicates the number density of events per pixel in logarithmic normalisation. Black points correspond to the mean surface area within each of 20 equally spaced bins in the lifetime. The blue dashed line indicates a linear fit to the binned (black) data. The correlation coefficient for the full dataset is 0.31. The correlation coefficient and slope of the linear fit to the binned data are shown in the legend.
Current usage metrics show cumulative count of Article Views (full-text article views including HTML views, PDF and ePub downloads, according to the available data) and Abstracts Views on Vision4Press platform.
Data correspond to usage on the plateform after 2015. The current usage metrics is available 48-96 hours after online publication and is updated daily on week days.
Initial download of the metrics may take a while.