Fig. 8.
Download original image
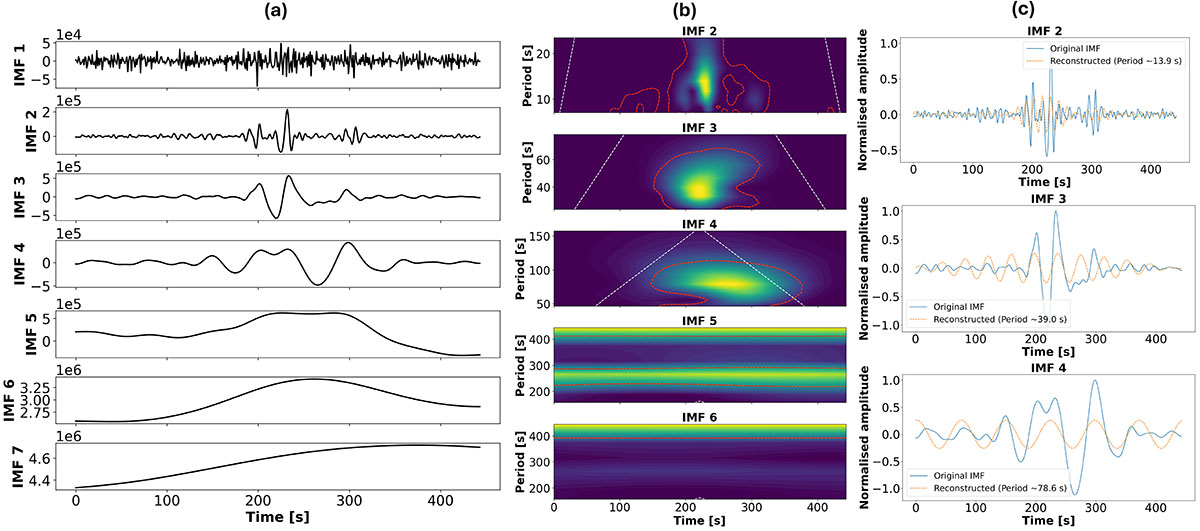
Example of ensemble empirical mode decomposition (EEMD) and wavelet analysis applied to the integrated light curve of the EUV brightening shown in Fig. 6a. (a) Intrinsic mode functions (IMFs) obtained using the EEMD technique. (b) Wavelet power spectra for the second to sixth IMFs. Darker to lighter colours indicate increasing power. The red solid line denotes the 95% significance level based on a red noise background, while the yellow dashed line corresponds to the 95% significance level for white noise. The white dashed curve outlines the cone of influence. (c) Comparison between the original IMF signals (blue) and their corresponding narrowband signals (orange dashed) reconstructed from the Fourier power spectrum at the dominant periods of 13.9, 39, and 78.6 s, identified in the 2nd to 4th IMFs.
Current usage metrics show cumulative count of Article Views (full-text article views including HTML views, PDF and ePub downloads, according to the available data) and Abstracts Views on Vision4Press platform.
Data correspond to usage on the plateform after 2015. The current usage metrics is available 48-96 hours after online publication and is updated daily on week days.
Initial download of the metrics may take a while.