Fig. H.1.
Download original image
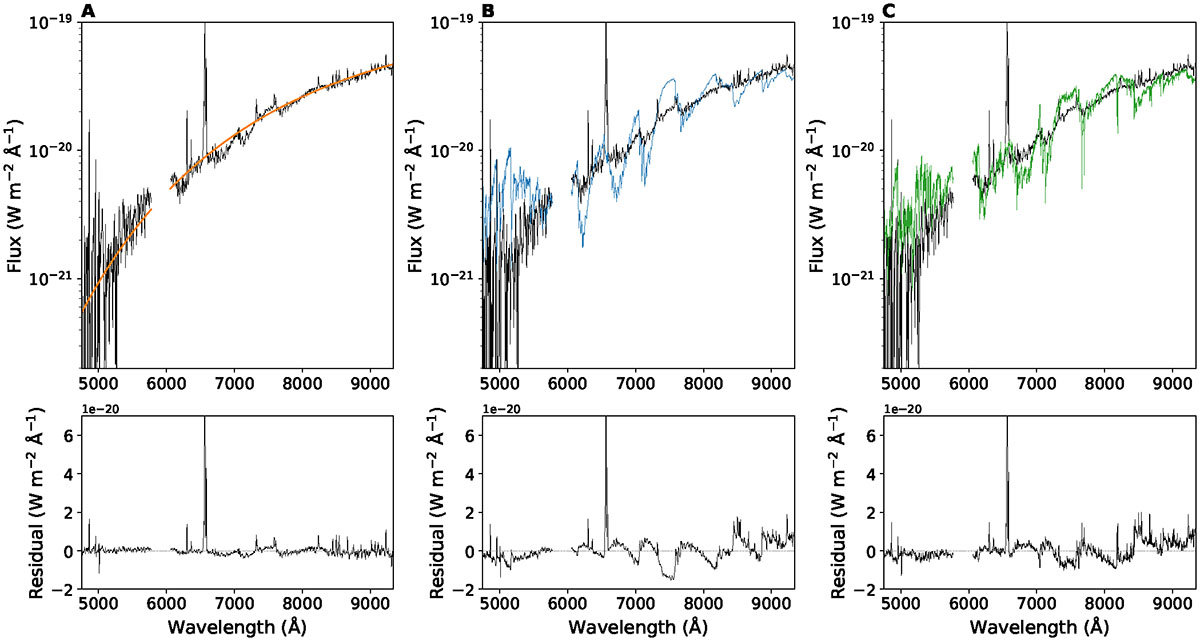
Spectrum of V2376 Ori b (black curve) compared to three models, with the corresponding residuals shown below each fit. (A) orange line shows a blackbody fit at T = 1900 ± 300 K. (B) comparison with the ATMO 2020 synthetic spectrum. The blue line shows the best-fit for T = 3000 K and log(g) = 4.0. (C) comparison with the BT-Cond model. The best-fit for T = 3000 K and log(g) = 5.0 is represented by the green line. Residuals are computed as the difference between the observed spectrum and each model.
Current usage metrics show cumulative count of Article Views (full-text article views including HTML views, PDF and ePub downloads, according to the available data) and Abstracts Views on Vision4Press platform.
Data correspond to usage on the plateform after 2015. The current usage metrics is available 48-96 hours after online publication and is updated daily on week days.
Initial download of the metrics may take a while.