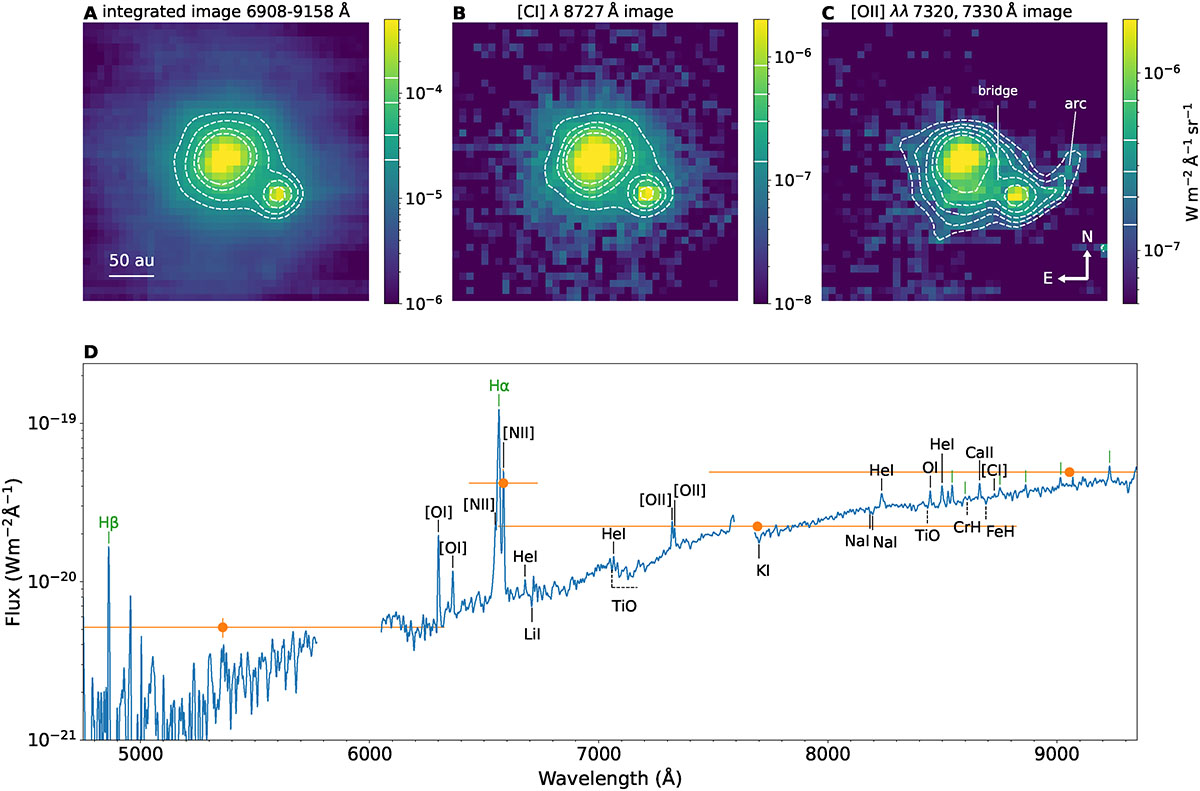
Fig. 2.
Download original image
(A–C) Continuum-subtracted maps. (A) Integrated cube (6908–9158 Å). (B) [C I] λ8272 integrated map. (C) Sum of the integrated maps of the [O II] doublet at 7320 and 7330 Å. Dashed white contours indicate intensity levels. Their spacings are indicated with the whites lines on the colour bars. (D) MUSE spectrum (blue) and HST photometry (orange dots) of V2376 Ori b. HST filter widths are indicated by orange bars. Green lines mark recombination features; other lines are labelled in black.
Current usage metrics show cumulative count of Article Views (full-text article views including HTML views, PDF and ePub downloads, according to the available data) and Abstracts Views on Vision4Press platform.
Data correspond to usage on the plateform after 2015. The current usage metrics is available 48-96 hours after online publication and is updated daily on week days.
Initial download of the metrics may take a while.