Fig. 3.
Download original image
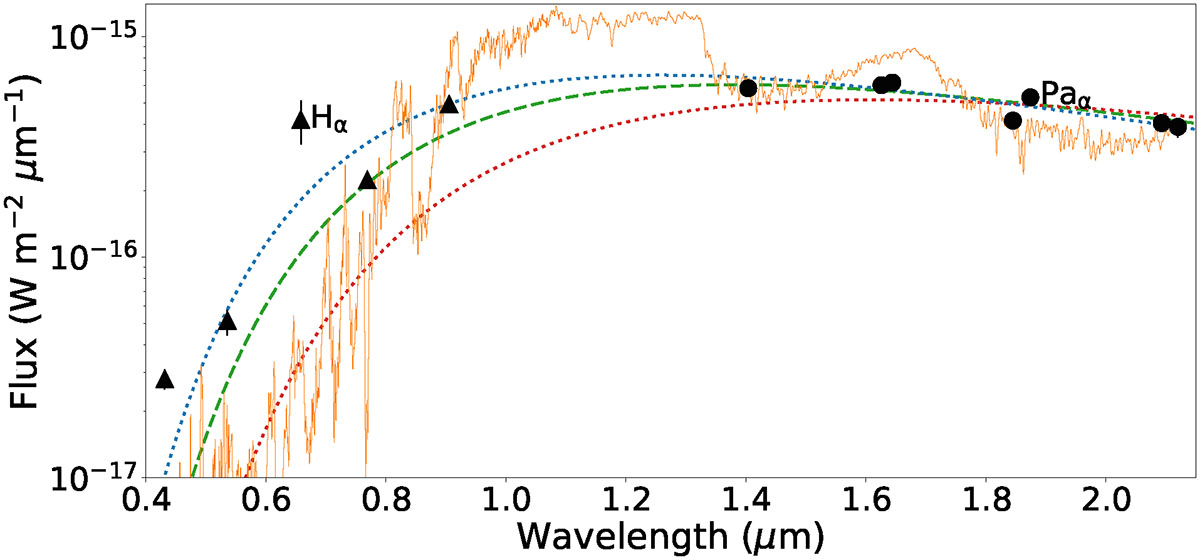
Spectral energy distribution (SED) of V2376 Ori b from HST (triangles) and JWST (dots) photometry, shown as black markers with error bars (invisible when smaller than markers). The dashed green line is the best-fit blackbody (T = 2100 K), with dotted red and blue lines showing the T = 1800 K and 2300 K limits. The orange line shows the best-fit BT-Cond model (T = 2400 K, log g = 4).
Current usage metrics show cumulative count of Article Views (full-text article views including HTML views, PDF and ePub downloads, according to the available data) and Abstracts Views on Vision4Press platform.
Data correspond to usage on the plateform after 2015. The current usage metrics is available 48-96 hours after online publication and is updated daily on week days.
Initial download of the metrics may take a while.