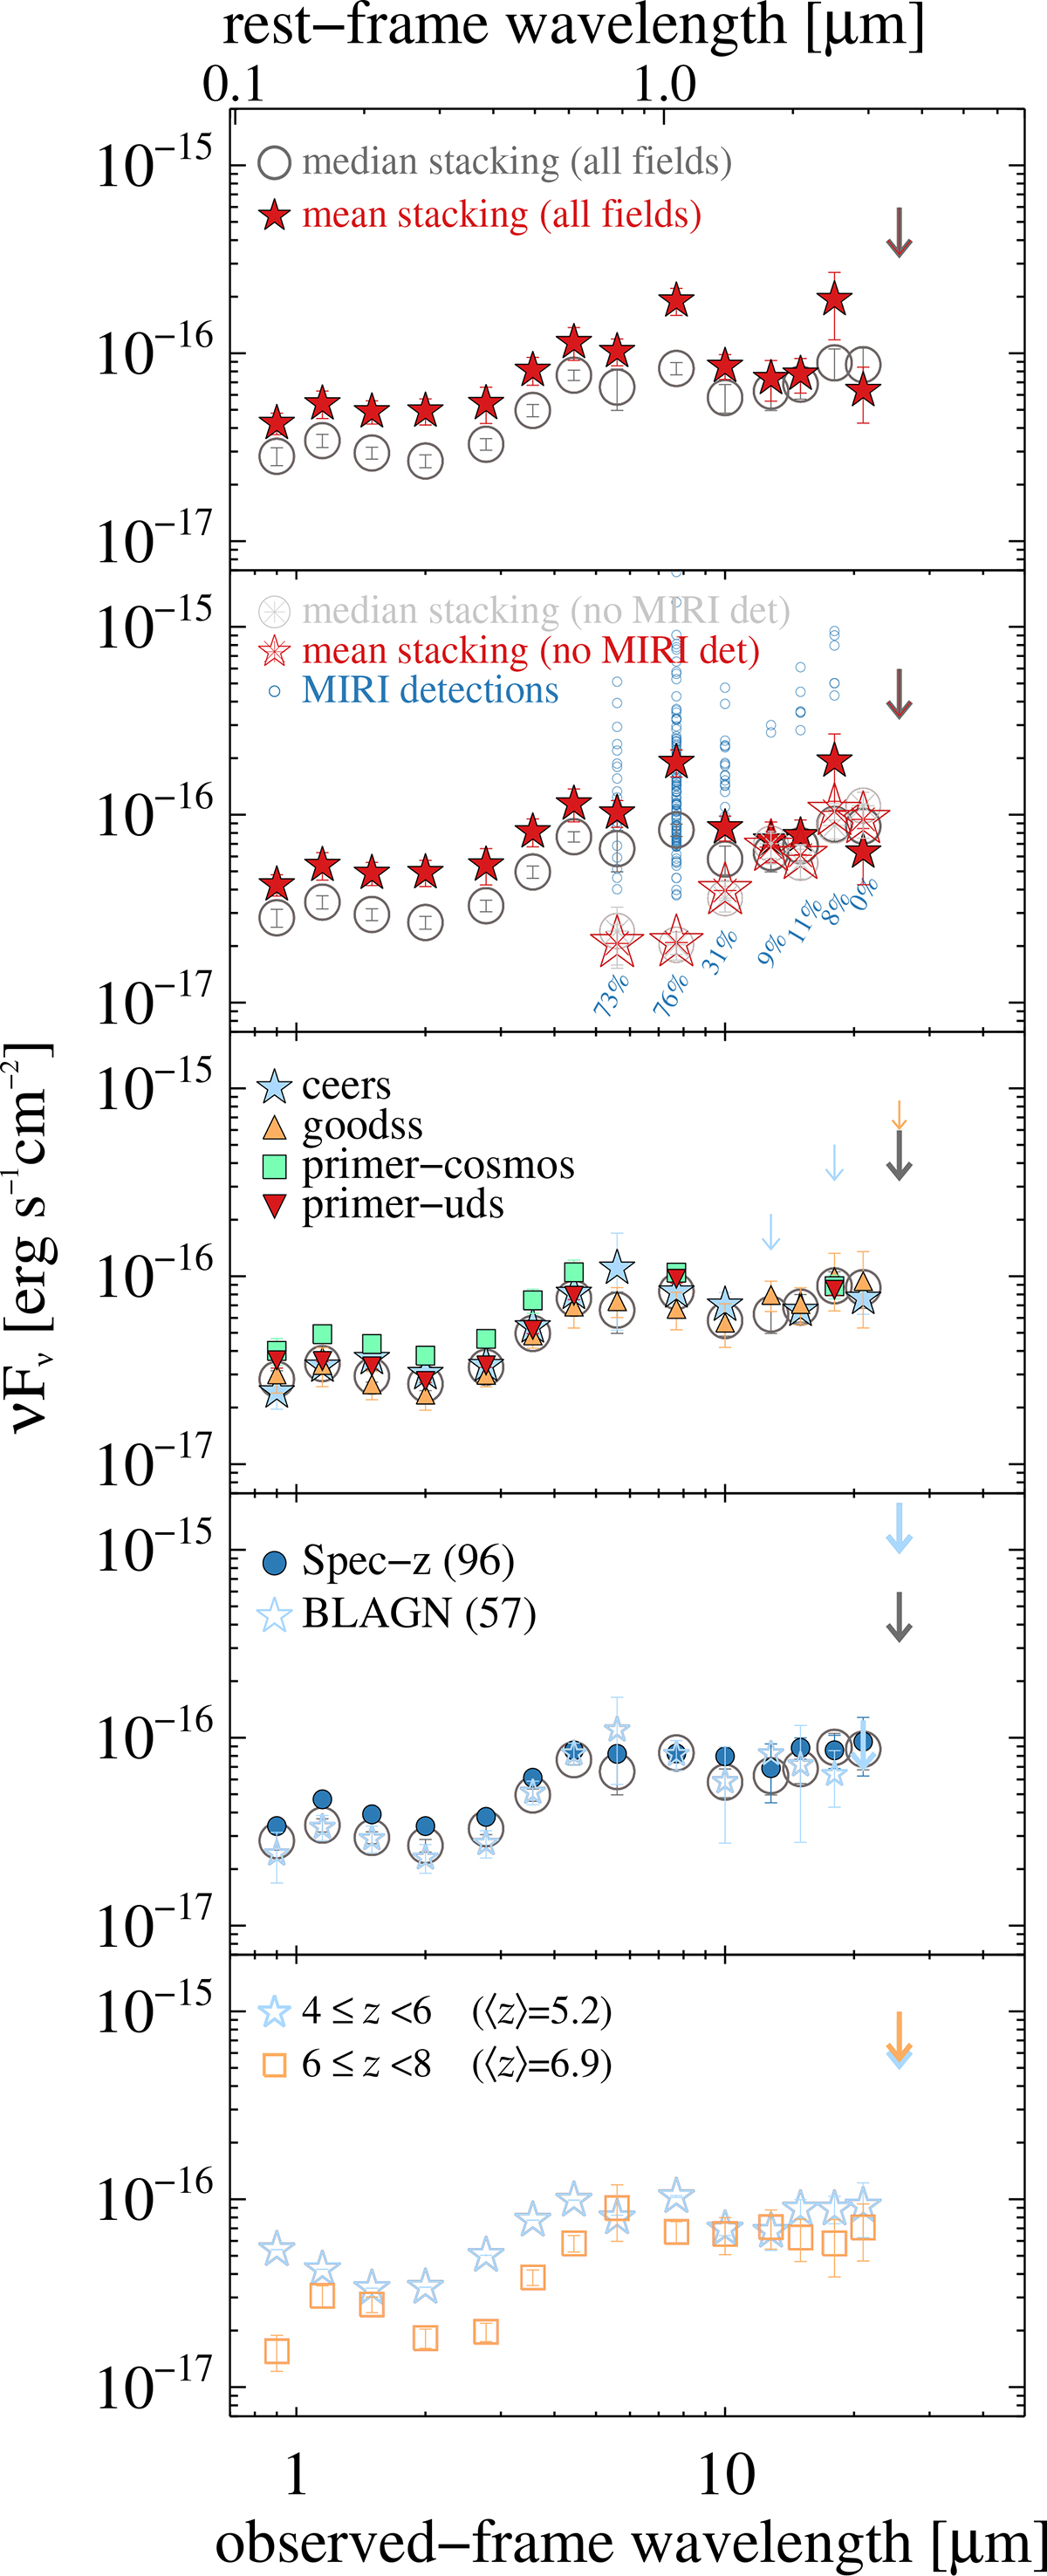
Fig. A.1.
Download original image
Summary plot comparing our median stacked fluxes (grey open circles) against multiple effects. From top to bottom: mean vs median stacking (Appendix A.1); contribution of MIRI detections (Appendix A.2); field-to-field variations (Appendix A.3); effect of photometric redshifts (Appendix A.4); effect of a broad redshift range (Appendix A.5). Details are given in the corresponding sub-sections.
Current usage metrics show cumulative count of Article Views (full-text article views including HTML views, PDF and ePub downloads, according to the available data) and Abstracts Views on Vision4Press platform.
Data correspond to usage on the plateform after 2015. The current usage metrics is available 48-96 hours after online publication and is updated daily on week days.
Initial download of the metrics may take a while.