Open Access
Fig. 1
Download original image
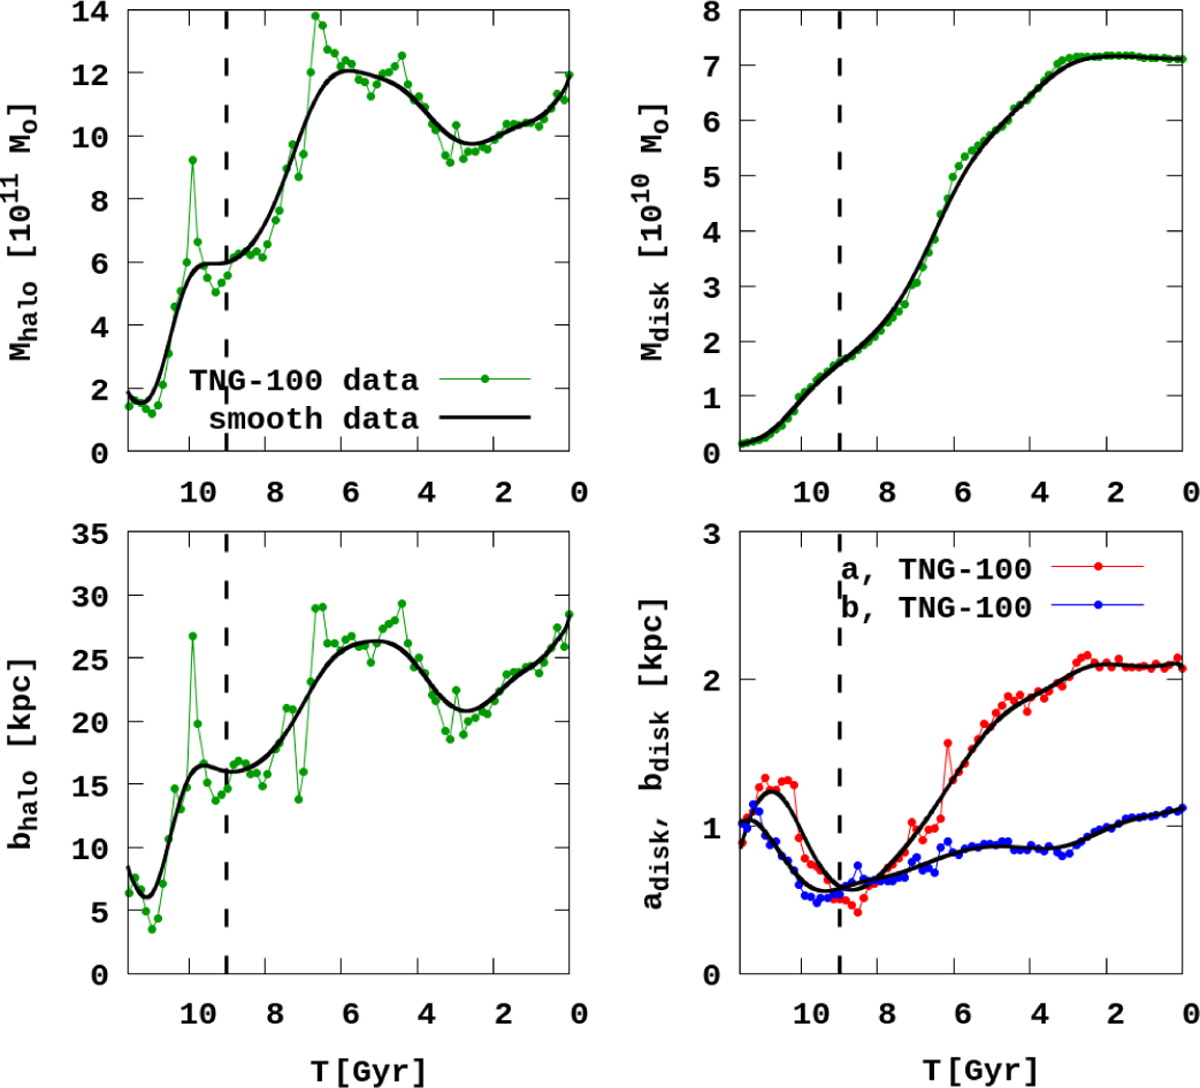
Evolution of halo and disc masses, and their characteristic scales for
411321external potential that are shown as thick black lines. Lines with dots represent the original TNG-100 data. The dashed line represents the 9 Gyr.
Current usage metrics show cumulative count of Article Views (full-text article views including HTML views, PDF and ePub downloads, according to the available data) and Abstracts Views on Vision4Press platform.
Data correspond to usage on the plateform after 2015. The current usage metrics is available 48-96 hours after online publication and is updated daily on week days.
Initial download of the metrics may take a while.