Open Access
Fig. 3
Download original image
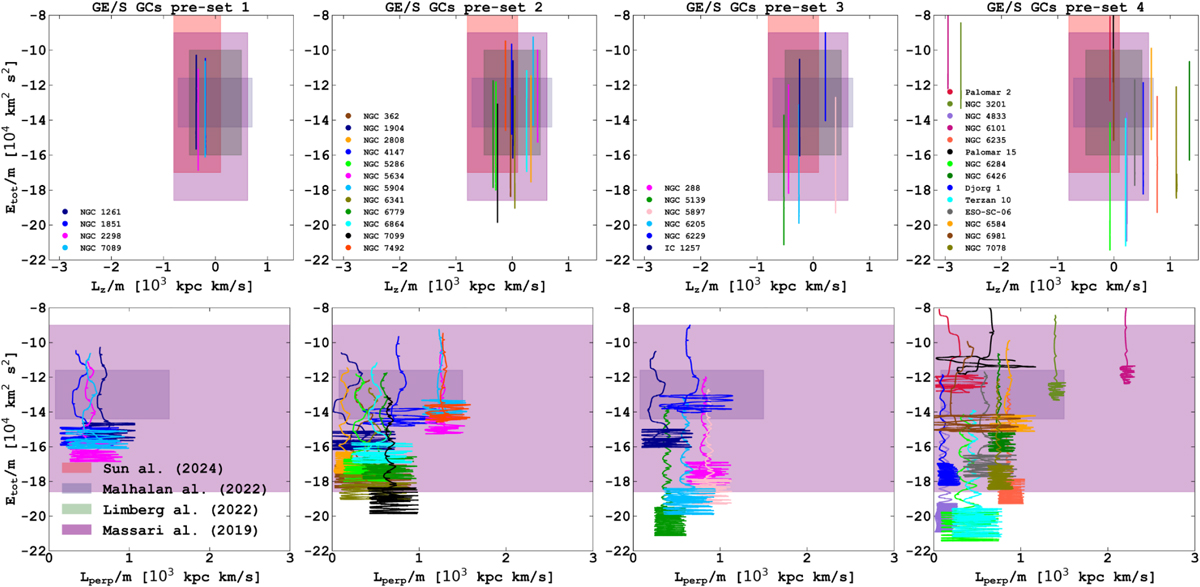
Evolution of the GCs phase-space parameters during the 9 Gyr lookback time integration in
411321TVP external potential for the four different pre-sets of GE/S GC’s (see Table 1). The upper row shows the evolution of the Lz and total energy; the bottom row of Lperp and total energy. All values are in specific units. Transparent coloured areas represent the limits of the phase-space for GE/S GCs based on publications from Table 2.
Current usage metrics show cumulative count of Article Views (full-text article views including HTML views, PDF and ePub downloads, according to the available data) and Abstracts Views on Vision4Press platform.
Data correspond to usage on the plateform after 2015. The current usage metrics is available 48-96 hours after online publication and is updated daily on week days.
Initial download of the metrics may take a while.