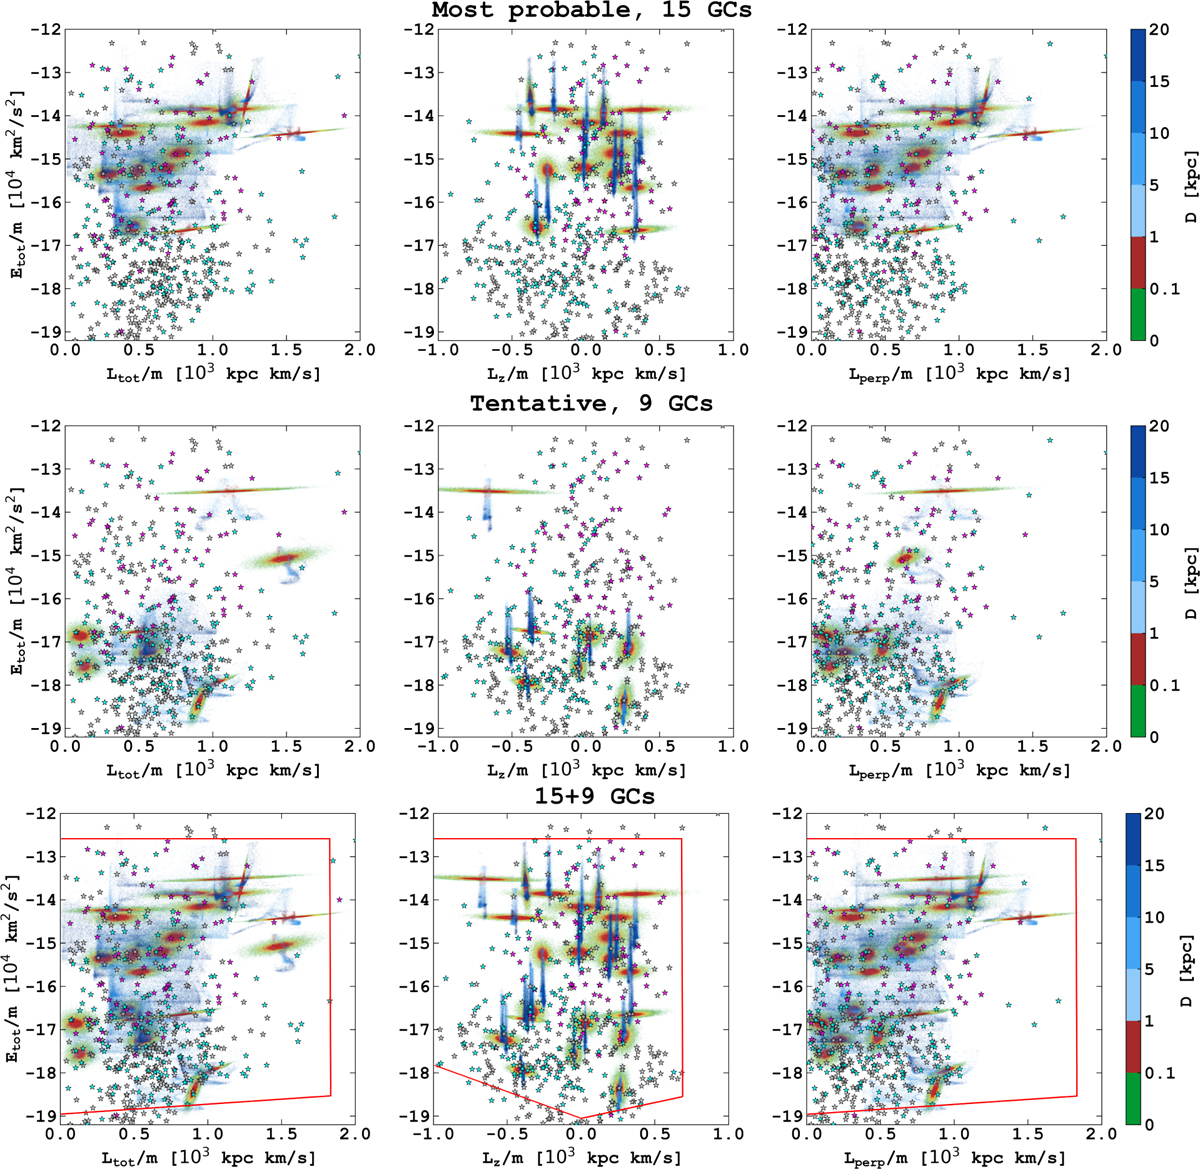
Fig. 7
Download original image
Distribution of the ejected stars from the GE/S GCs together with the selected VMP stars. The colour-coding bar for GCs represents the relative distance from the GC density centre itself. Cyan star symbols represent GE/S stars from Molaro et al. (2020), magenta – Ernandes et al. (2024), and grey – the Ye et al. (2024) sample, respectively.
Current usage metrics show cumulative count of Article Views (full-text article views including HTML views, PDF and ePub downloads, according to the available data) and Abstracts Views on Vision4Press platform.
Data correspond to usage on the plateform after 2015. The current usage metrics is available 48-96 hours after online publication and is updated daily on week days.
Initial download of the metrics may take a while.