Fig. 12.
Download original image
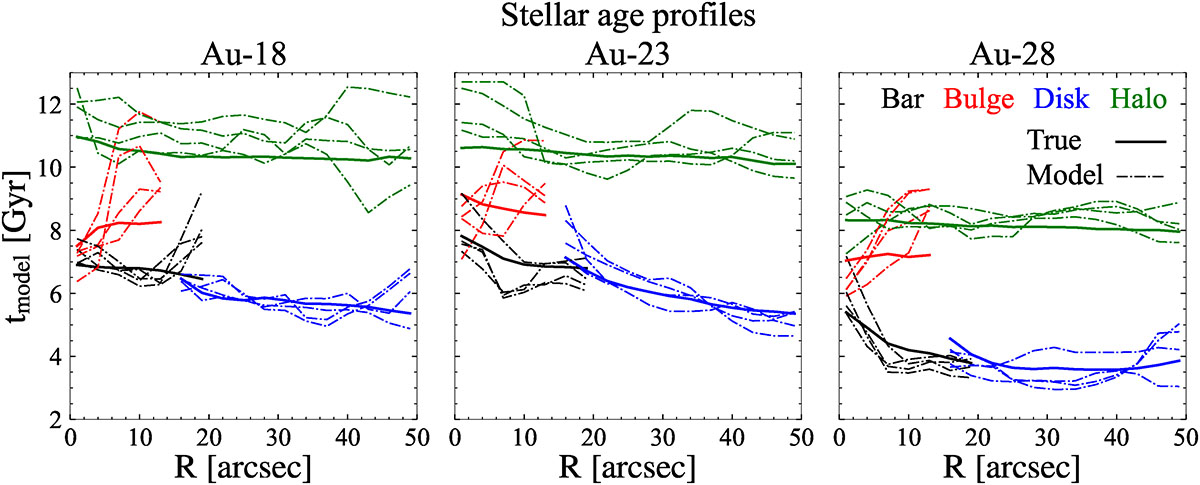
Comparison of the true and model-predicted stellar age profiles of different structures. From left to right, the panels display age profiles for Au-18, Au-23, and Au-28. The black, red, blue, and green lines denote the bar, bulge, disc, and stellar halo components, respectively. The solid lines represent the true mass-weighted age profiles, while the dashed lines denote the corresponding model-predicted profiles derived from mock datasets with different viewing angles.
Current usage metrics show cumulative count of Article Views (full-text article views including HTML views, PDF and ePub downloads, according to the available data) and Abstracts Views on Vision4Press platform.
Data correspond to usage on the plateform after 2015. The current usage metrics is available 48-96 hours after online publication and is updated daily on week days.
Initial download of the metrics may take a while.