Fig. 4.
Download original image
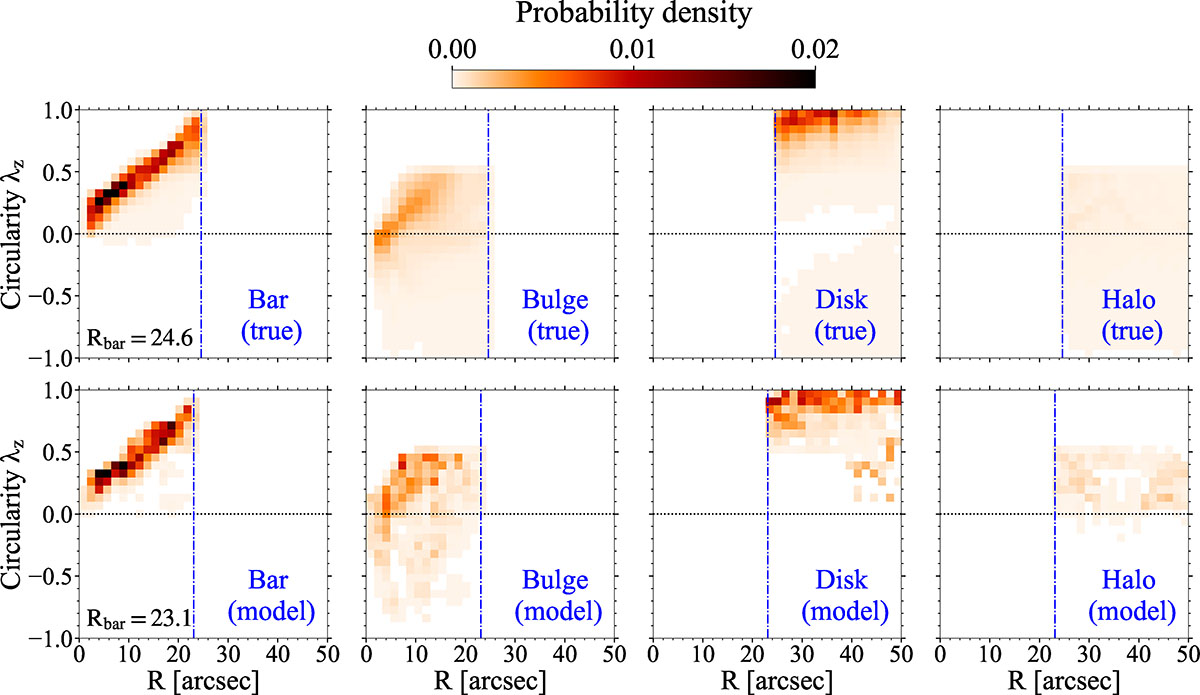
True and model-predicted probability density distributions of stellar orbits in the λz–R phase space for different structures in Au-23. The top panels indicate the true distributions while the bottom panels represent the model results from Au-23-85-50. From left to right, the panels show the stellar orbit distributions for the bar, the bulge, the disc, and the stellar halo. The probability densities of all orbits within the data coverage (R ≤ 50 arcsec) are normalised to unity, with their values indicated by the colour bar. The horizontal black dotted lines denote λz = 0. The vertical blue dashed lines represent the true and model-predicted bar lengths, Rbar, derived from orbit analysis, with their values shown in the text.
Current usage metrics show cumulative count of Article Views (full-text article views including HTML views, PDF and ePub downloads, according to the available data) and Abstracts Views on Vision4Press platform.
Data correspond to usage on the plateform after 2015. The current usage metrics is available 48-96 hours after online publication and is updated daily on week days.
Initial download of the metrics may take a while.