Fig. 8.
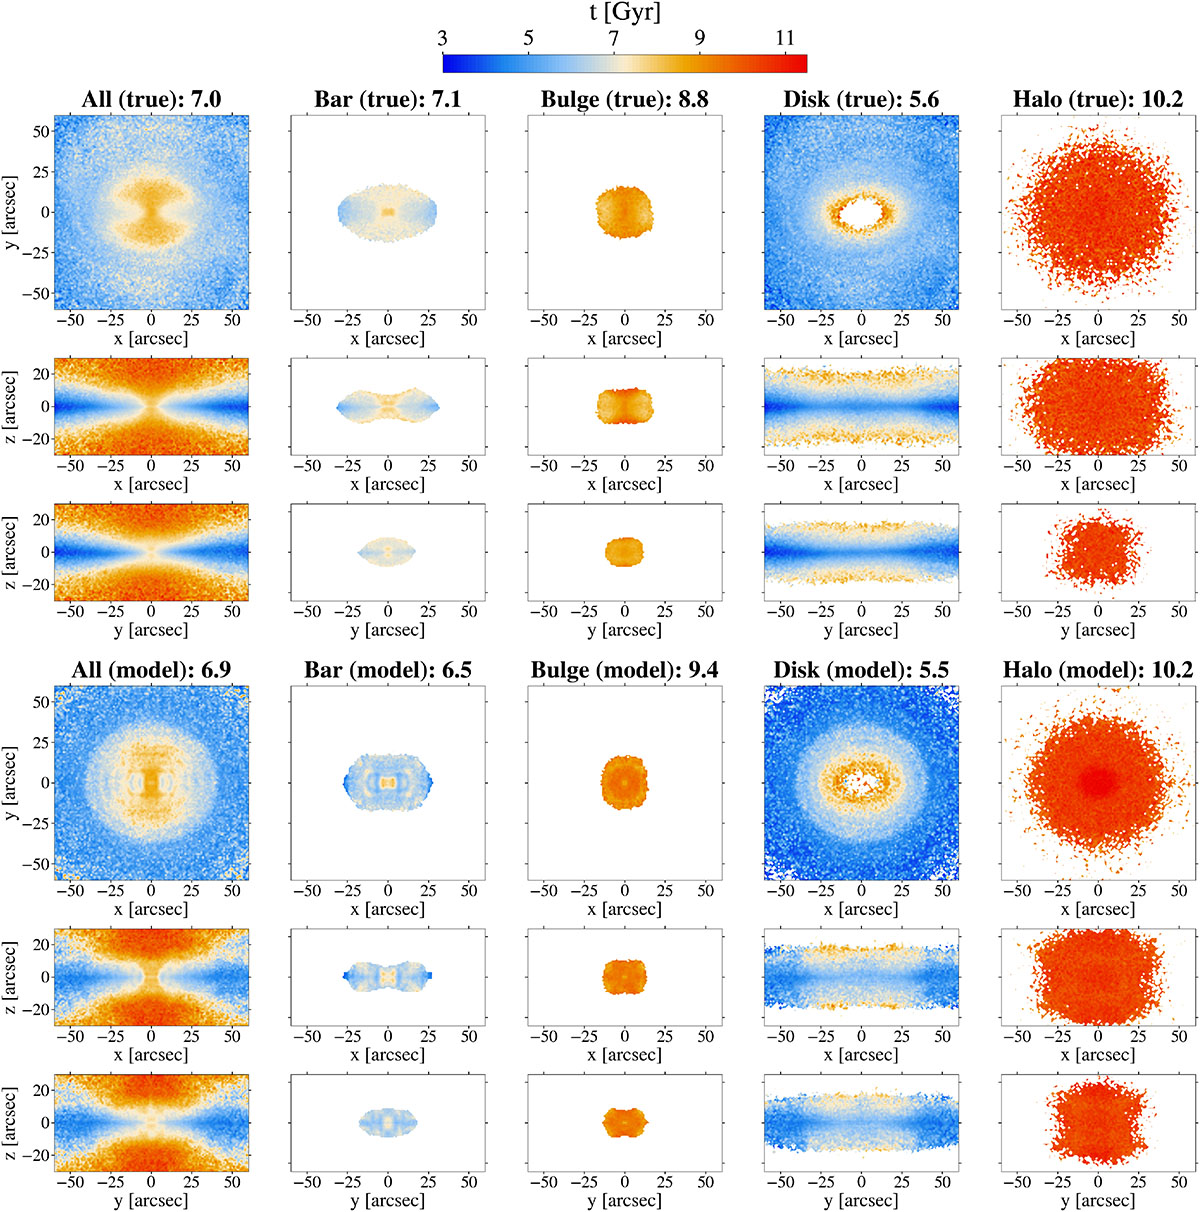
Download original image
Spatial distributions of stellar ages for model-decomposed structures in Au-23-85-50 compared with their true counterparts. The top three rows display the stellar age distributions of Au-23 projected onto the internal x-y, x-z, and y-z planes, while the bottom three rows show the model-predicted results for Au-23-85-50. From left to right, the panels show the stellar age distributions of the entire galaxy, the bar, the bulge, the disc, and the stellar halo. To highlight the age distributions, we only plot pixels brighter than 1% of the galaxy’s brightness pixel for the bar and bulge, and 0.1% for the disc and halo. The mass-weighted mean stellar ages of the entire galaxy and all components were calculated within the 60 × 60 × 30 arcsec3 volume (aligned with the axis ranges in the panels), with their values shown in the text.
Current usage metrics show cumulative count of Article Views (full-text article views including HTML views, PDF and ePub downloads, according to the available data) and Abstracts Views on Vision4Press platform.
Data correspond to usage on the plateform after 2015. The current usage metrics is available 48-96 hours after online publication and is updated daily on week days.
Initial download of the metrics may take a while.