Fig. 1.
Download original image
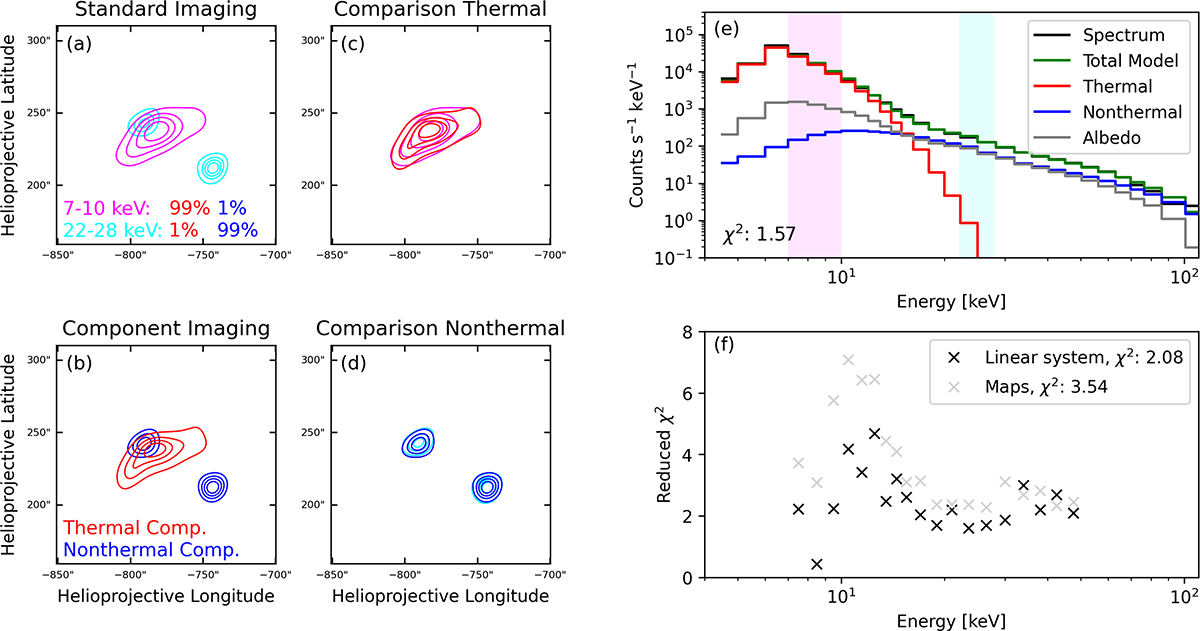
Images and spectrum of the M5-class flare SOL2023-05-16. Panel (a) shows the reconstructed maps of the energy ranges 7−10 keV (magenta) and 22−28 keV (light blue). The percentages give the contribution of the spectral components, thermal in red and nonthermal in blue, respectively. Panel (b) shows the reconstructed maps of the thermal (red) and nonthermal (blue) spectral components as derived from spectral component imaging. Panels (c) and (d) show the comparison of predetermined energy ranges with the spectral component imaging results for the thermal emission, panel c, and the nonthermal emission, panel d. The contour levels shown in all panels are 20, 40, 60, and 80% of the peak values of the maps. Solar Orbiter was at a distance of 0.69 AU to the Sun. Panel (e) shows the spectrum of the time step used for imaging together with the fitted models. Panel (f) shows the χ2 results for the spectral component imaging approach as a function of energy. The χ2’s in the legend are the values averaged over all energies.
Current usage metrics show cumulative count of Article Views (full-text article views including HTML views, PDF and ePub downloads, according to the available data) and Abstracts Views on Vision4Press platform.
Data correspond to usage on the plateform after 2015. The current usage metrics is available 48-96 hours after online publication and is updated daily on week days.
Initial download of the metrics may take a while.