Fig. 2.
Download original image
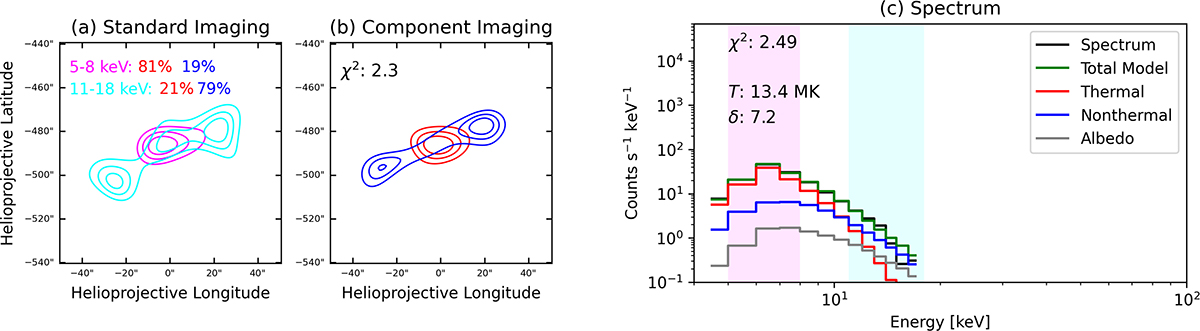
Results using specific energy ranges and spectral component imaging for SOL2023-03-07, with Solar Orbiter at a distance of 0.68 AU to the Sun. In panel a, the maps using the energy ranges 5−8 keV in magenta and 11−18 keV in light blue are shown. These energy ranges are also marked in the spectrum shown in panel c. In panel b, the maps of spectral component imaging are shown, solving for a thermal (red) and nonthermal (blue) component, together with the map-χ2 of the spectral component imaging method. The contour levels shown in the plots are 40, 60, 80%. In panel c, the spectrum at the time of the image is given. We have fit a thermal (red), nonthermal (blue), and albedo (gray) component to the spectrum. The temperature of the thermal fit, the power-law index of the nonthermal distribution and the χ2 of the fit is given in panel c as well.
Current usage metrics show cumulative count of Article Views (full-text article views including HTML views, PDF and ePub downloads, according to the available data) and Abstracts Views on Vision4Press platform.
Data correspond to usage on the plateform after 2015. The current usage metrics is available 48-96 hours after online publication and is updated daily on week days.
Initial download of the metrics may take a while.