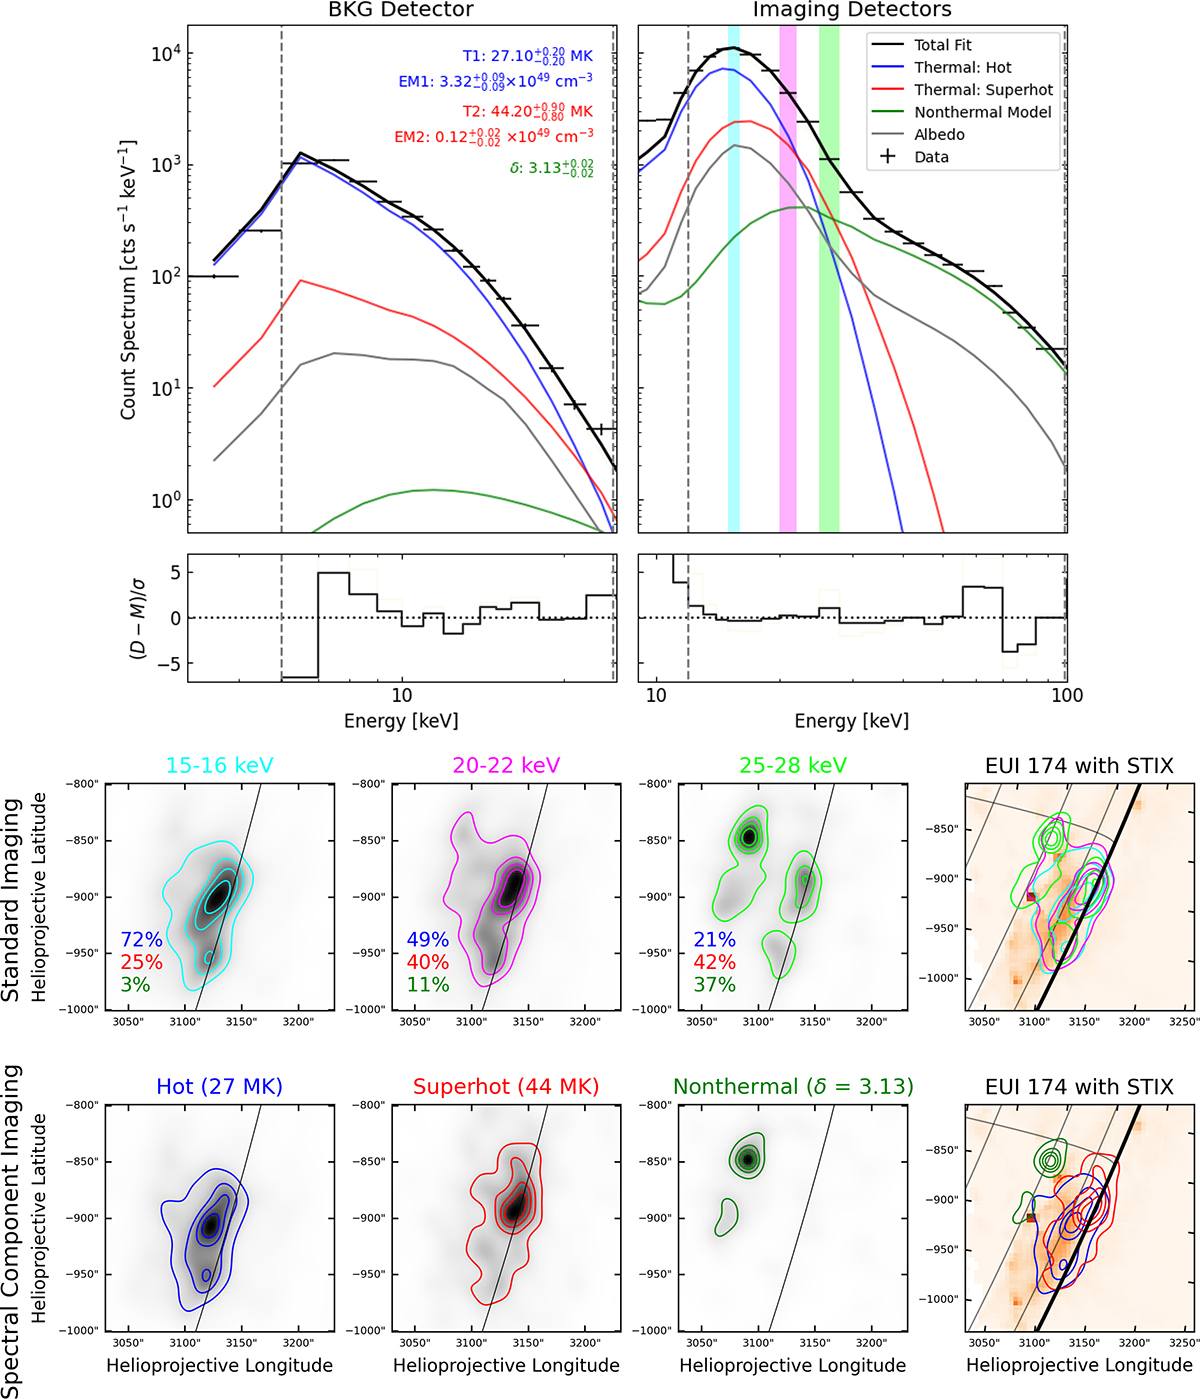
Fig. 4.
Download original image
Images and spectrum of the X7-class flare SOL2024-10-01. Top two panels: Spectra of the BKG detector (left) and the imaging detectors (right). We jointly fit a photon model to the two spectra containing a hot thermal (blue), superhot thermal (red), nonthermal (green), and albedo (gray) component. The total fit is given in black. The ranges between the dashed gray lines indicate the energy ranges considered for spectral fitting. 3% systematic errors are added in quadrature to the residuals. The colored energy ranges in the spectrum are the ranges used for reconstruction and are shown in the first row of maps. For each energy range, we give the percentage of each spectral component contributing to this energy range. In the second row, we plotted the outcome of spectral component imaging, solving for the three components: hot thermal (blue), superhot thermal (red), and nonthermal (green). The contour levels of all plots shown are 20, 40, 60, 80% of the maximum. The plots in the right column are EUI 174 Å short exposures with STIX contours. The time range shown here is 22:14:20–22:14:50 UTC (Earth time), a time range around the main nonthermal peak measured by STIX. Solar Orbiter is at a distance of 0.29 AU to the Sun.
Current usage metrics show cumulative count of Article Views (full-text article views including HTML views, PDF and ePub downloads, according to the available data) and Abstracts Views on Vision4Press platform.
Data correspond to usage on the plateform after 2015. The current usage metrics is available 48-96 hours after online publication and is updated daily on week days.
Initial download of the metrics may take a while.