Fig. 1
Download original image
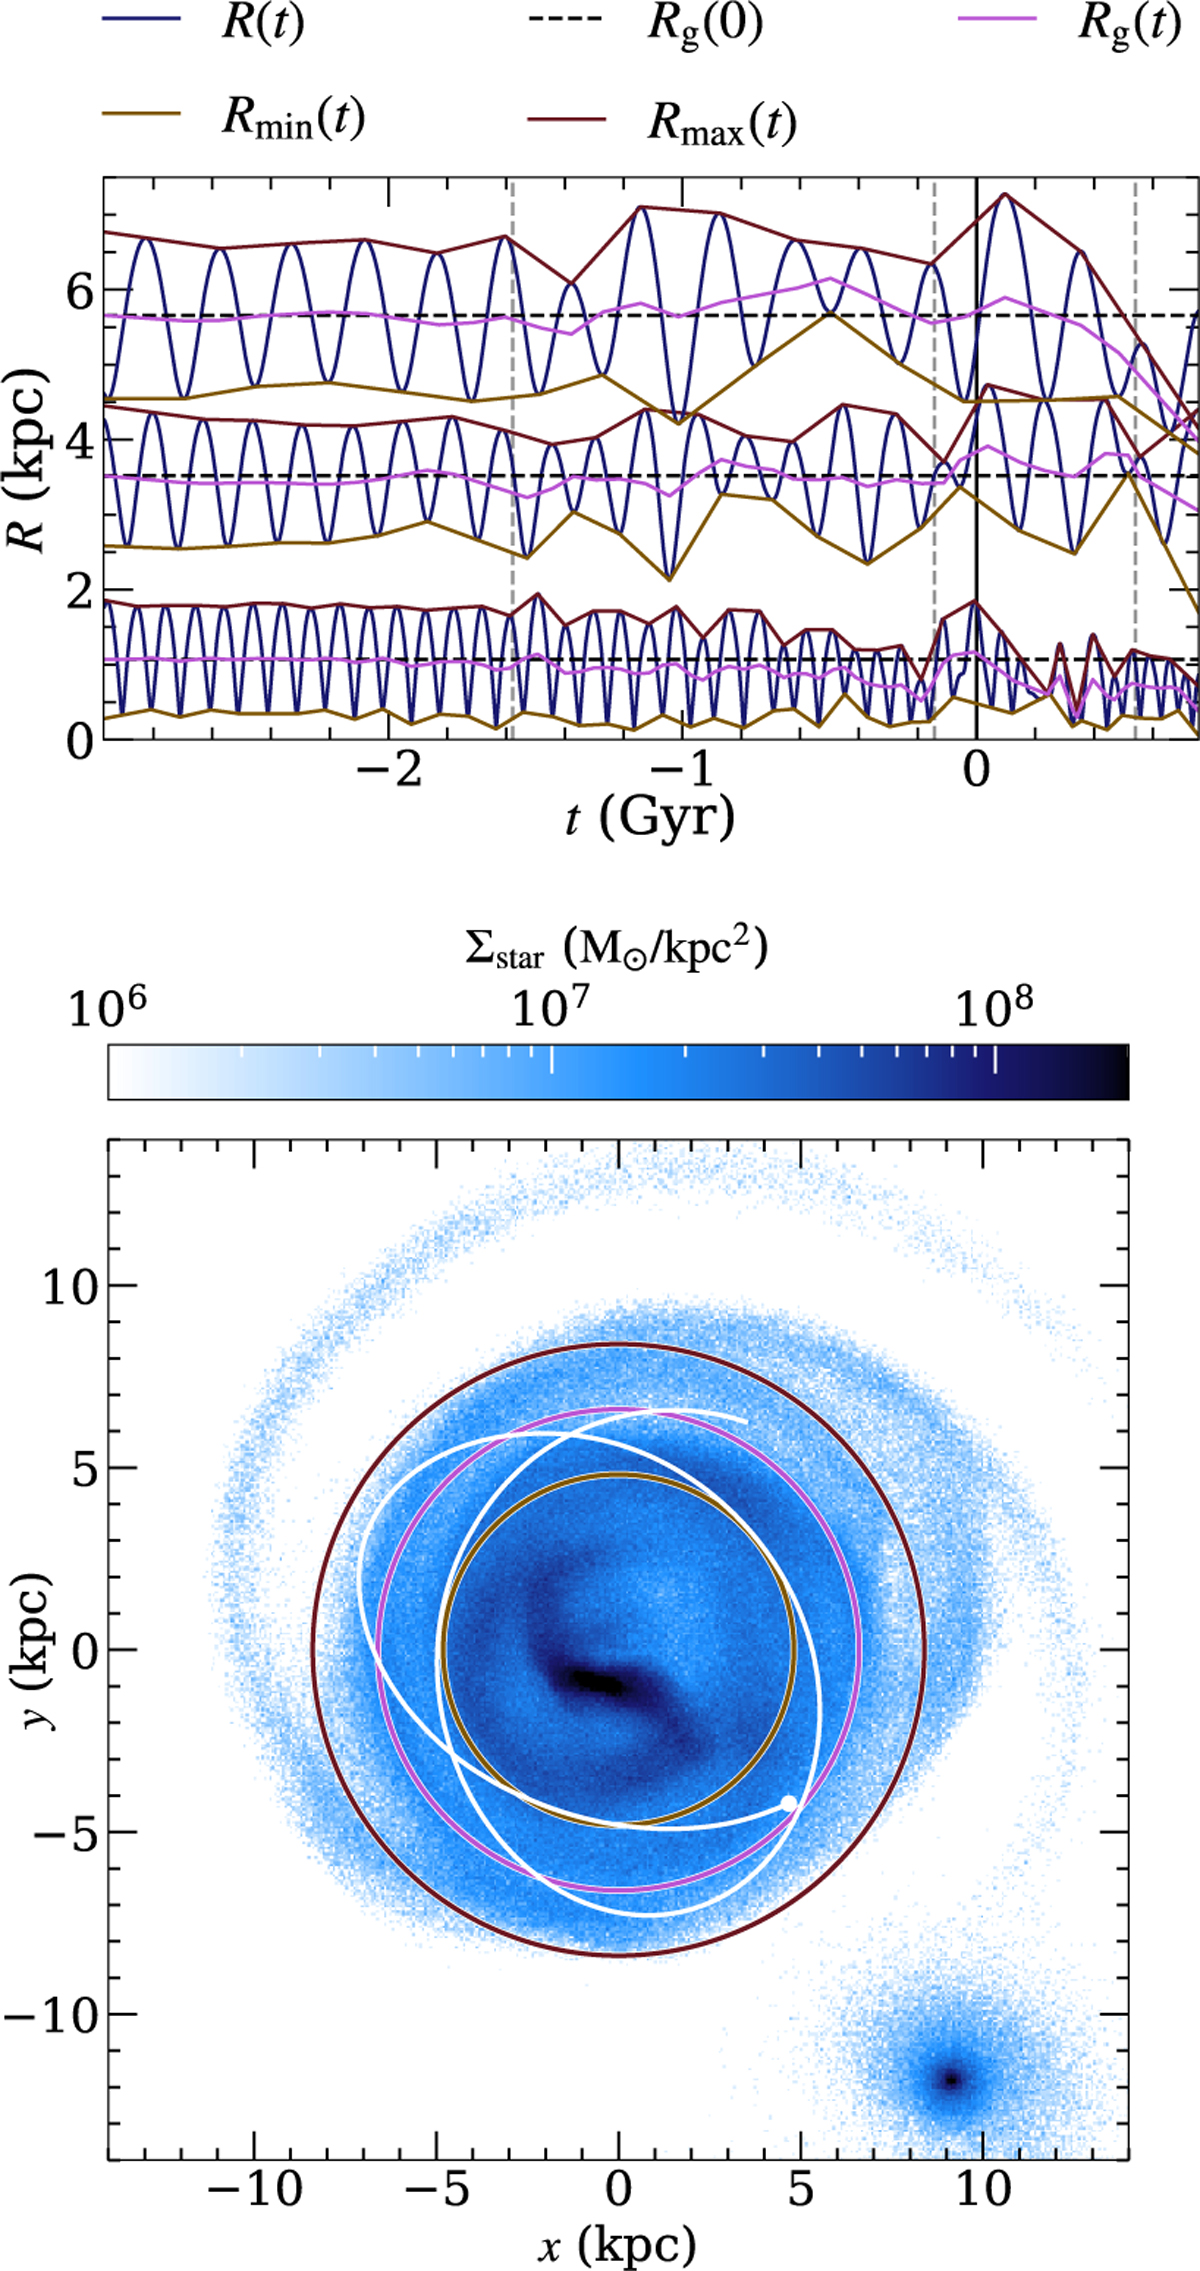
Top: visualisation of the method described in Halle et al. (2015) to infer the Rg(t) of the particles: the radial evolution of three random particles in the K9i simulation with respect to time. Rg(t) (pink) is the mean of Rmax(t) (dark brown) and Rmin(t) (light brown), and its value at the start of the simulation is Rg(ti) (horizontal dashed black line). The times of the pericentre passages of GSMC are shown in vertical dashed grey lines, and the evolution of the galactocentric radius of the particles, R(t), is the dark blue curve. The black vertical line represents the t=0 snapshot that is displayed on the bottom panel. Bottom: visualisation of the method for inferring the guiding radius, Rg(t), of a particle at t=0 (same legend as above, with the previous orbit of the particle in white). The shown particle is the particle with the highest radius from the top panel. GS MC is shown in the lower right hand corner, but its particles are not tracked in this work. An animated visualisation is available online.
Current usage metrics show cumulative count of Article Views (full-text article views including HTML views, PDF and ePub downloads, according to the available data) and Abstracts Views on Vision4Press platform.
Data correspond to usage on the plateform after 2015. The current usage metrics is available 48-96 hours after online publication and is updated daily on week days.
Initial download of the metrics may take a while.