Fig. 2
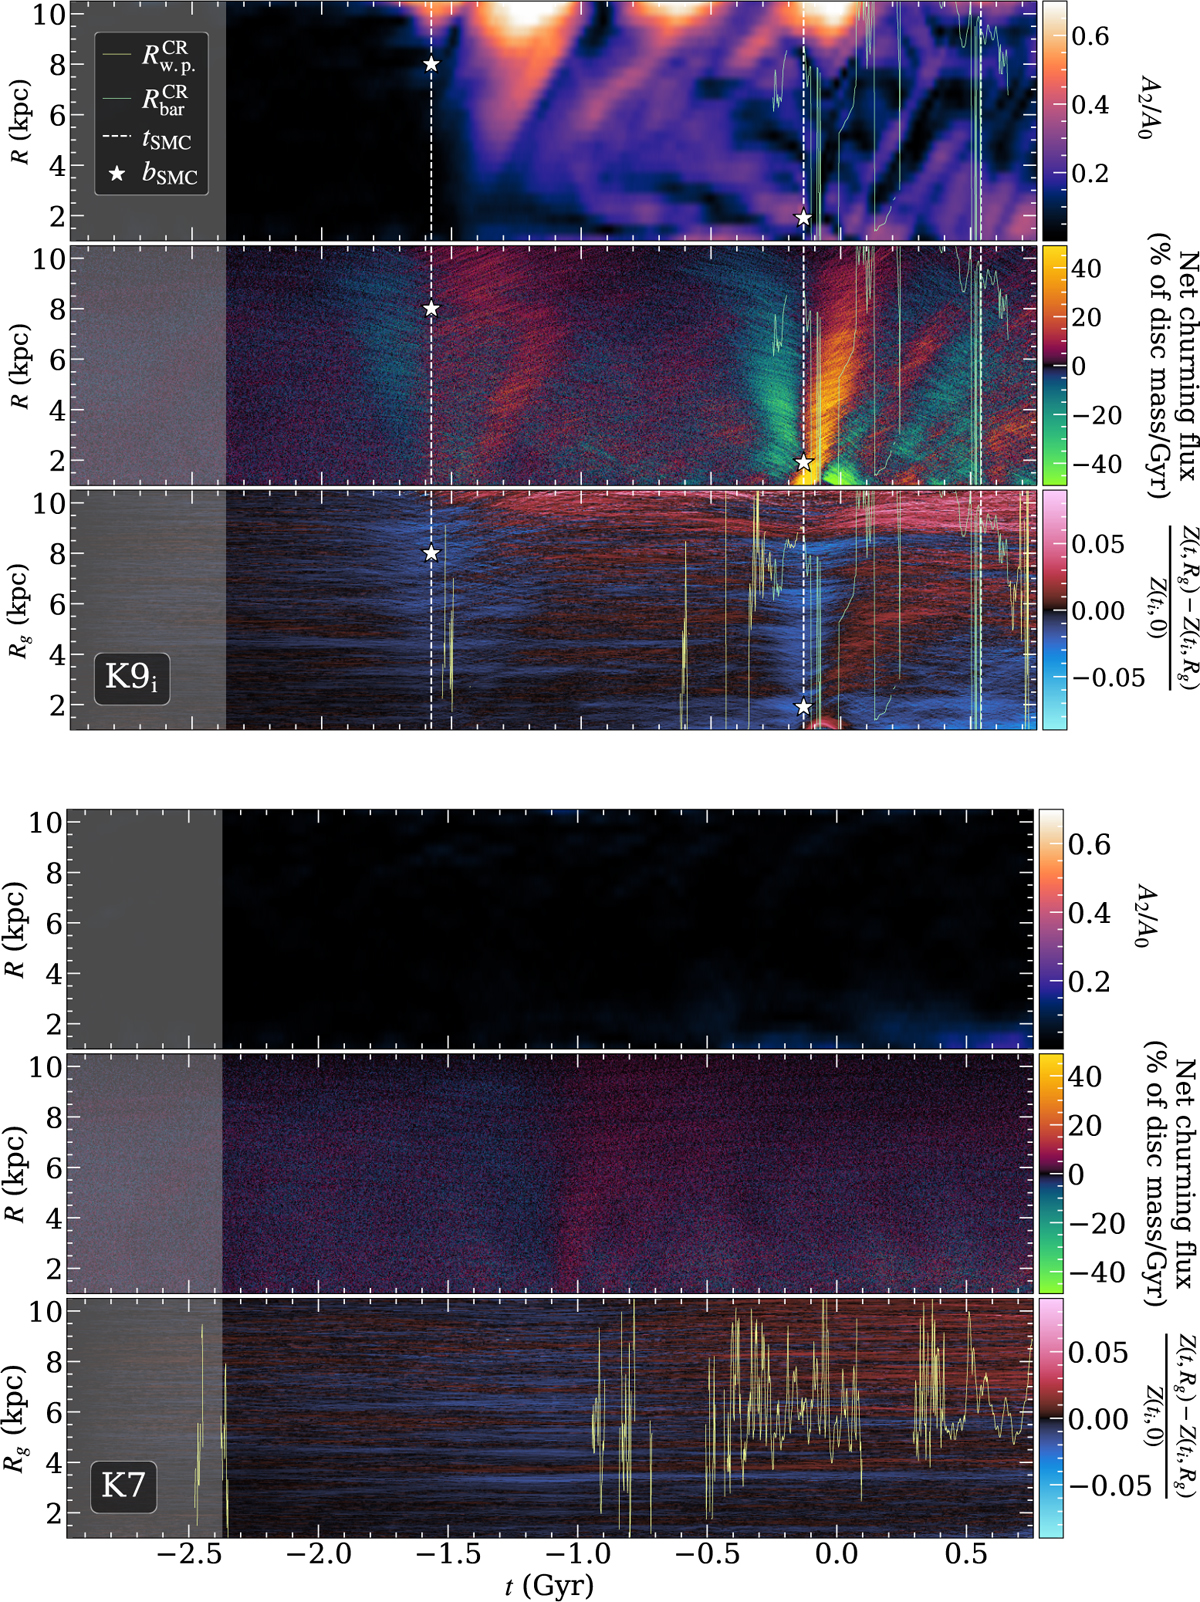
Download original image
Maps of A2/A0 Fourier mode strength (top panel), difference between the churning fluxes outwards and inwards (central panel, counted positive outwards), and normalised metallicity evolution (bottom panel) with respect to time and galactocentric radius, R, or guiding radius, Rg(t), for the K9i (interacting Q=1.5 simulation, top three panels) and K7 simulations (isolated Q=1.5 simulation, bottom three panels). The grey area masks the first 0.6 Gyr displayed, when the disc is not fully relaxed yet. For the K9i maps, the times of the pericentre passages of GSMC are shown in dashed white lines, and its impact parameters are the white stars. The corotation radius is plotted in green and yellow for resonance with a bar or a weak central pattern, respectively.
Current usage metrics show cumulative count of Article Views (full-text article views including HTML views, PDF and ePub downloads, according to the available data) and Abstracts Views on Vision4Press platform.
Data correspond to usage on the plateform after 2015. The current usage metrics is available 48-96 hours after online publication and is updated daily on week days.
Initial download of the metrics may take a while.