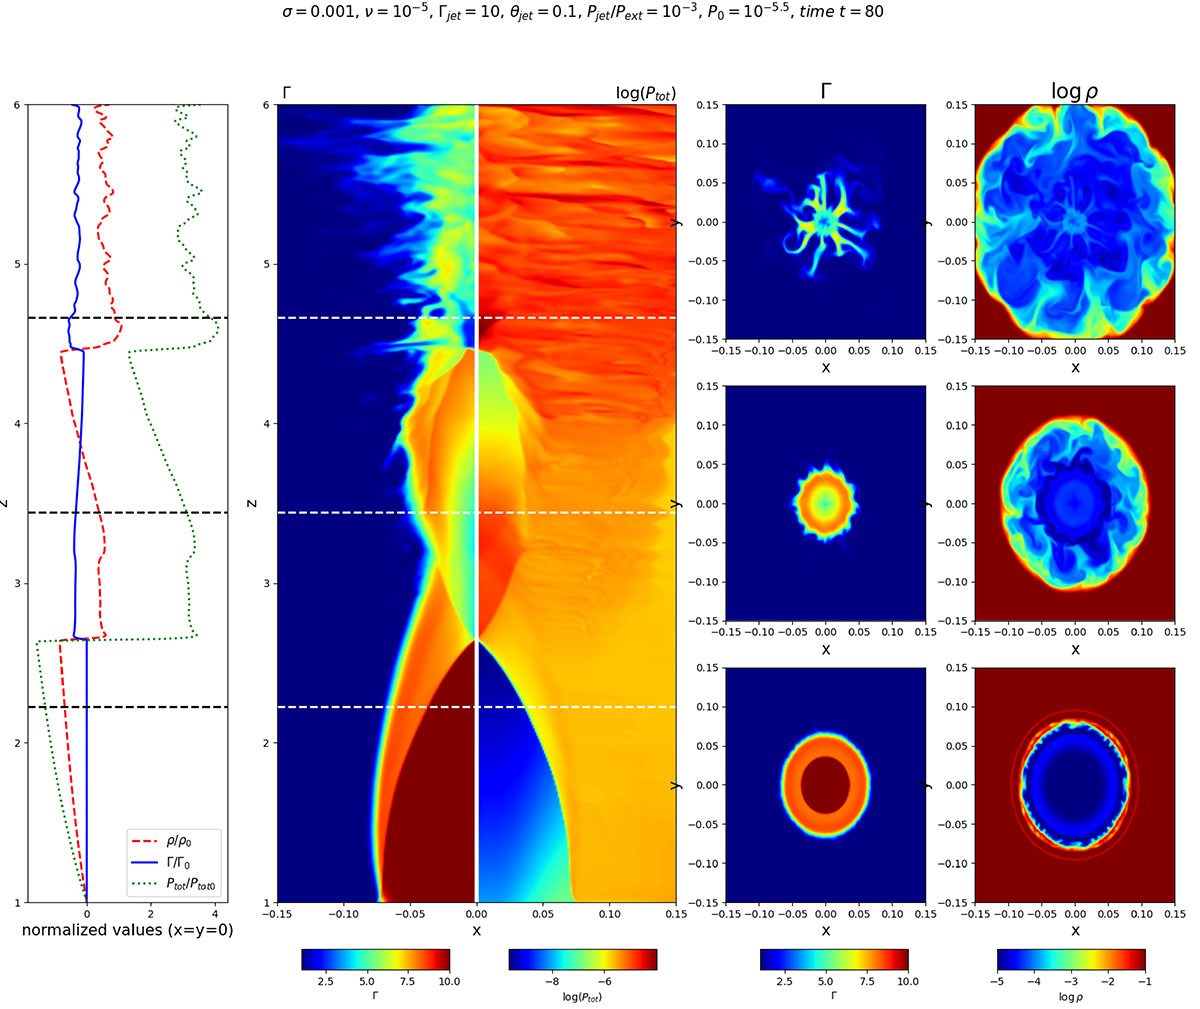
Fig. D.1.
Download original image
First column: logarithmic normalized profiles along the z-axis at position x = 0 for density ρ, Lorentz factor Γ, and total pressure Ptot for the 3D case A with magnetization σ = 0.001. The other columns include the map of Γ and log Ptot, and cuts at three different z-positions, where the lines in the profiles and maps correspond to these cuts, showing the Lorentz factor and logarithmic density.
Current usage metrics show cumulative count of Article Views (full-text article views including HTML views, PDF and ePub downloads, according to the available data) and Abstracts Views on Vision4Press platform.
Data correspond to usage on the plateform after 2015. The current usage metrics is available 48-96 hours after online publication and is updated daily on week days.
Initial download of the metrics may take a while.