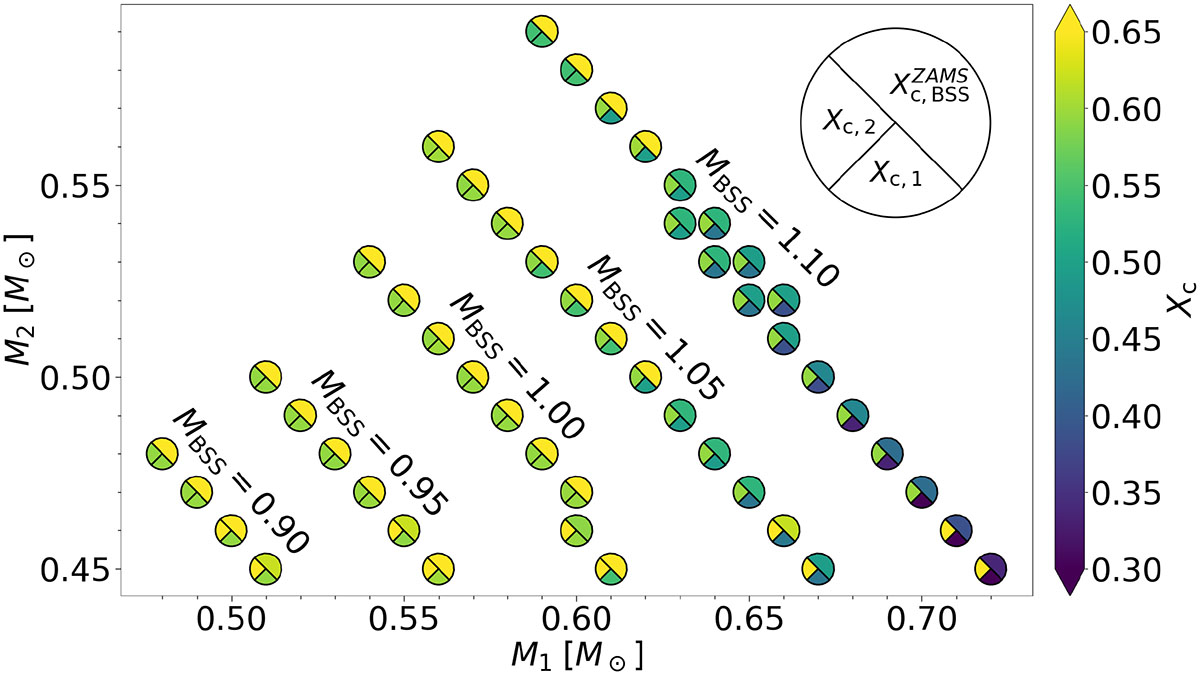
Fig. 1.
Download original image
Representation of BSS grid. The x-axis and y-axis report all the different values of M1 and M2, respectively. Each point is divided into three sectors, indicating the values of Xc for the primary (bottom sector) and the secondary star (left sector) at the time of the collision, and the value of Xc for the BSS at the zero age MS (ZAMS; top right sector). The colour-coding for Xc is reported on the left. The colour-bar ranges from 0.3 to 0.65. Values out of this range are coloured as the closest extreme on the colour scale. The BSSs’ masses are reported inside the plot, rounded to the closest multiple of 0.01.
Current usage metrics show cumulative count of Article Views (full-text article views including HTML views, PDF and ePub downloads, according to the available data) and Abstracts Views on Vision4Press platform.
Data correspond to usage on the plateform after 2015. The current usage metrics is available 48-96 hours after online publication and is updated daily on week days.
Initial download of the metrics may take a while.