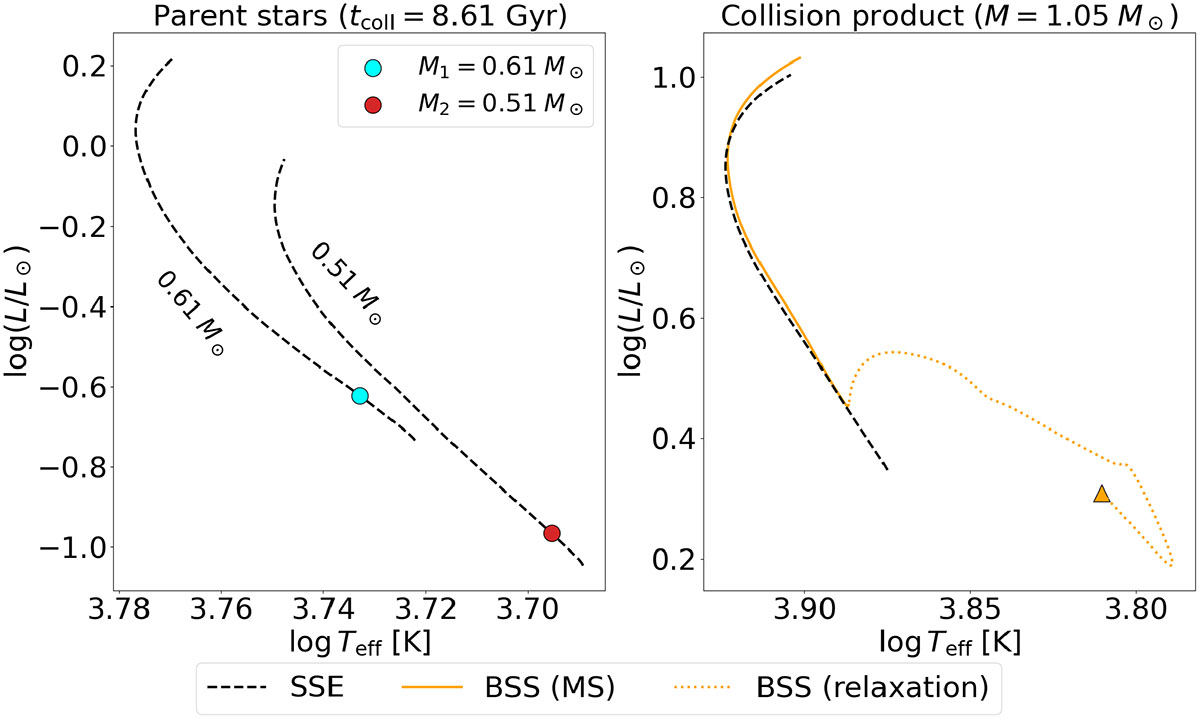
Fig. 2.
Download original image
HRDs of collision between an M1 = 0.61 M⊙ star and a M2 = 0.51 M⊙ star. Left panel: Evolutionary tracks of parent stars (dashed black lines), with the position of the parent stars at the moment of the collision (cyan for the primary, red for the secondary). Right panel: Evolutionary tracks of BSS (orange; dotted lines = relaxation, solid lines = MS) and of the equivalent-mass SSE star (black dashed line). The triangle marks where the relaxation phase starts.
Current usage metrics show cumulative count of Article Views (full-text article views including HTML views, PDF and ePub downloads, according to the available data) and Abstracts Views on Vision4Press platform.
Data correspond to usage on the plateform after 2015. The current usage metrics is available 48-96 hours after online publication and is updated daily on week days.
Initial download of the metrics may take a while.