Fig. 3.
Download original image
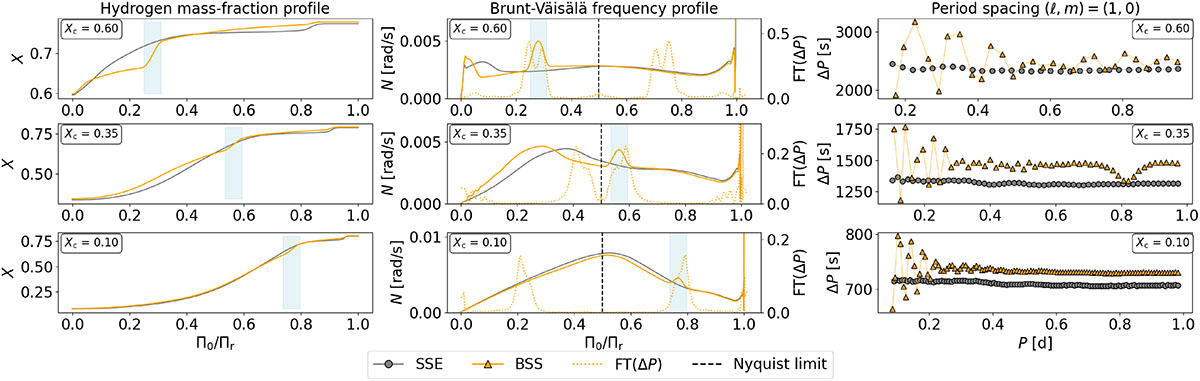
Comparison between a 1.05 M⊙ BSS (M1 = 0.61 M⊙, M2 = 0.51 M⊙; orange) and its SSE counterpart (grey) for different values of Xc (0.60, 0.35, and 0.10; from top row to bottom row). Left column: Evolution of X profile in g-mode cavity as a function of normalised buoyancy radius, Π0/Πr. Centre column: Evolution of N as function of Π0/Πr (solid lines). The dotted orange line represents the FT of the BSS’s PSP, with the Nyquist limit (Π0/Πr = 0.5) indicated by the dashed black line. Right column: Evolution of PSPs for dipole modes (note that the scales on the period-axis are not the same for all the panels). In the left and centre panels, a light blue shaded region marks the position of the glitch, which corresponds to the steepening of the X profile and to the additional peak in the N profile.
Current usage metrics show cumulative count of Article Views (full-text article views including HTML views, PDF and ePub downloads, according to the available data) and Abstracts Views on Vision4Press platform.
Data correspond to usage on the plateform after 2015. The current usage metrics is available 48-96 hours after online publication and is updated daily on week days.
Initial download of the metrics may take a while.