Fig. 6
Download original image
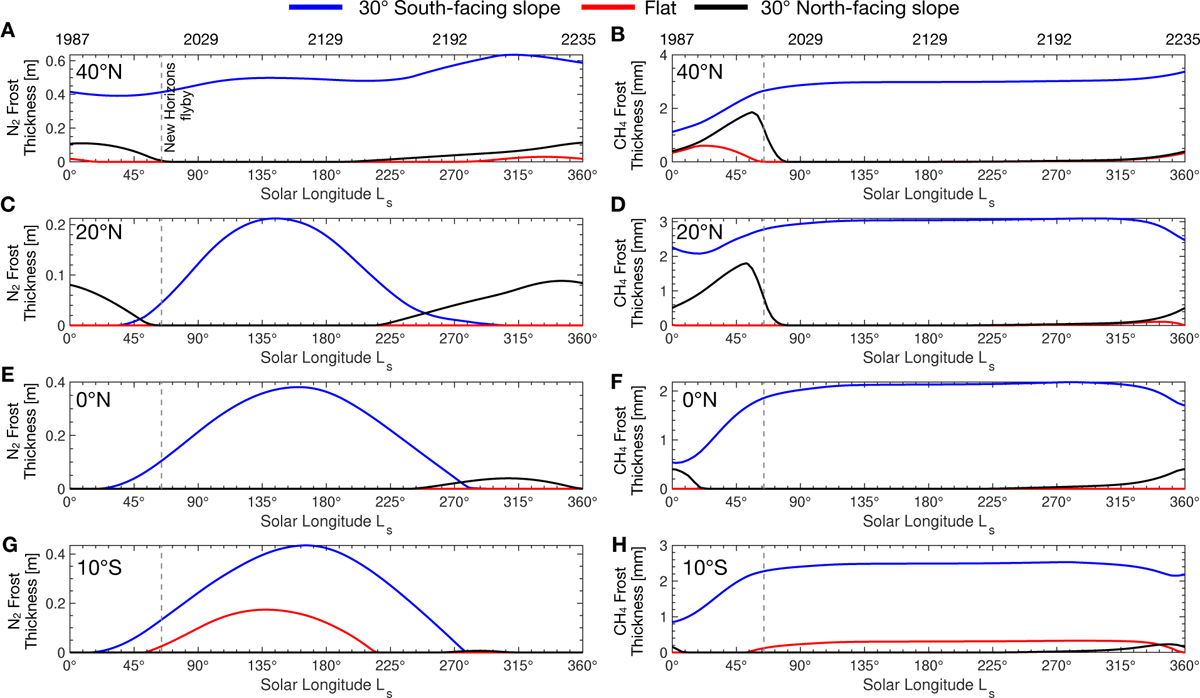
Seasonal evolution of frost on 30° south-facing slopes (blue), flat surfaces (red), and 30° north-facing slopes (black) on Pluto, shown for latitudes 40°N (A, B), 20°N (C, D), 0°N (E, F), and 10°S (G, H). For each latitude, N2 frost thickness is shown in the left panels, and CH4 frost thickness in the right panels. The dashed gray line marks the date of the New Horizons flyby. For cases with perennial accumulations, thickness values have been rescaled for clarity. The frost thicknesses shown here are zonal averages of the model outputs between 40°E and 150°E, corresponding to the Cthulhu region.
Current usage metrics show cumulative count of Article Views (full-text article views including HTML views, PDF and ePub downloads, according to the available data) and Abstracts Views on Vision4Press platform.
Data correspond to usage on the plateform after 2015. The current usage metrics is available 48-96 hours after online publication and is updated daily on week days.
Initial download of the metrics may take a while.