Fig. 11
Download original image
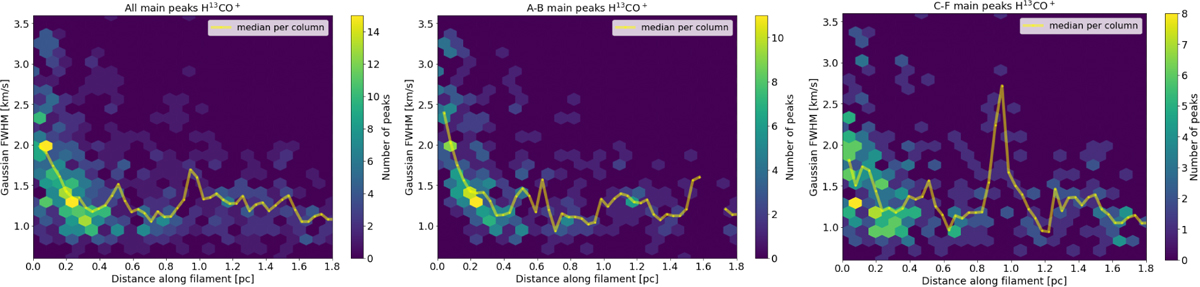
2D histograms showing the distribution of the linewidths of spectra (i.e., the FWHM of the Gaussian fits to their main peaks) within filaments over their distance from the core they are connected to in H13CO+(1–0). The yellow line and dots show the median value of each column. Left: all cores. Middle: evolved cores (A, B). Right: younger cores (C–F). The spike in the mean value for cores C-F at ~1 pc is likely caused by unresolved multiple components and low statistical sampling.
Current usage metrics show cumulative count of Article Views (full-text article views including HTML views, PDF and ePub downloads, according to the available data) and Abstracts Views on Vision4Press platform.
Data correspond to usage on the plateform after 2015. The current usage metrics is available 48-96 hours after online publication and is updated daily on week days.
Initial download of the metrics may take a while.