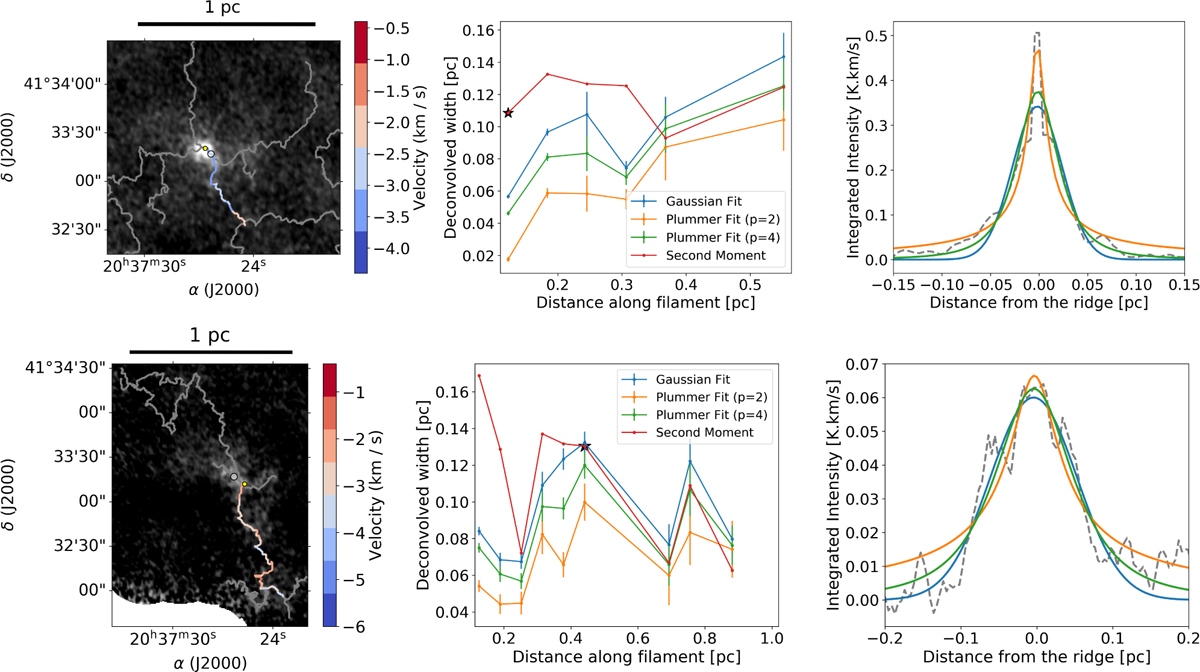
Fig. 14
Download original image
De-convolved widths of filament slices of core D in HCO+(1–0) (D2) and in H13CO+(1–0) (D4) determined with FilChaP. Rows: HCO+(1–0) and H13CO+(1–0). Left: core D. The white dot within the core shows the coordinates of the continuum source; the yellow dot shows the filament “origin”, corresponding to a distance of zero. The filament corresponding to the plot is colored by the velocity of the channel it was identified in. The green color indicates the other analyzed filaments in this region; the ones not shown here can be found in the supplementary material available at Zenodo (Figs. B.30–B.45). Middle: de-convolved width of the filament slices plotted over the distance from the core (or more precisely, the filament “origin”, yellow dot in the image). A distance of zero thereby corresponds to the slice closest to the core. The error bars show the deconvolved FWHM errors resulting from the errors of the corresponding parameters of the respective fit to the radial profile given in the covariance matrix of the curve_fit function used in FilChaP. The black star marks the filament width resulting from the spectrum shown in the right plot. Right: example of an intensity profile, as averaged by FilChaP (dashed gray line), and its fits at the position of the filament marked with a black star in the middle plot.
Current usage metrics show cumulative count of Article Views (full-text article views including HTML views, PDF and ePub downloads, according to the available data) and Abstracts Views on Vision4Press platform.
Data correspond to usage on the plateform after 2015. The current usage metrics is available 48-96 hours after online publication and is updated daily on week days.
Initial download of the metrics may take a while.